Tweezer Bottom Candlestick Pattern: A Comprehensive Exploration
In the vast universe of technical analysis, few candlestick patterns evoke as much interest and intrigue as the Tweezer Bottom. Revered for its potential to signal trend reversals, particularly from a downtrend to an uptrend, the Tweezer Bottom stands as a beacon of hope for traders seeking opportune entry points in the market. In this extensive article, we embark on an in-depth journey into the Tweezer Bottom pattern, unraveling its complexities, exploring its significance, and delving into strategies for leveraging its potential effectively.
Unveiling the Tweezer Bottom Pattern
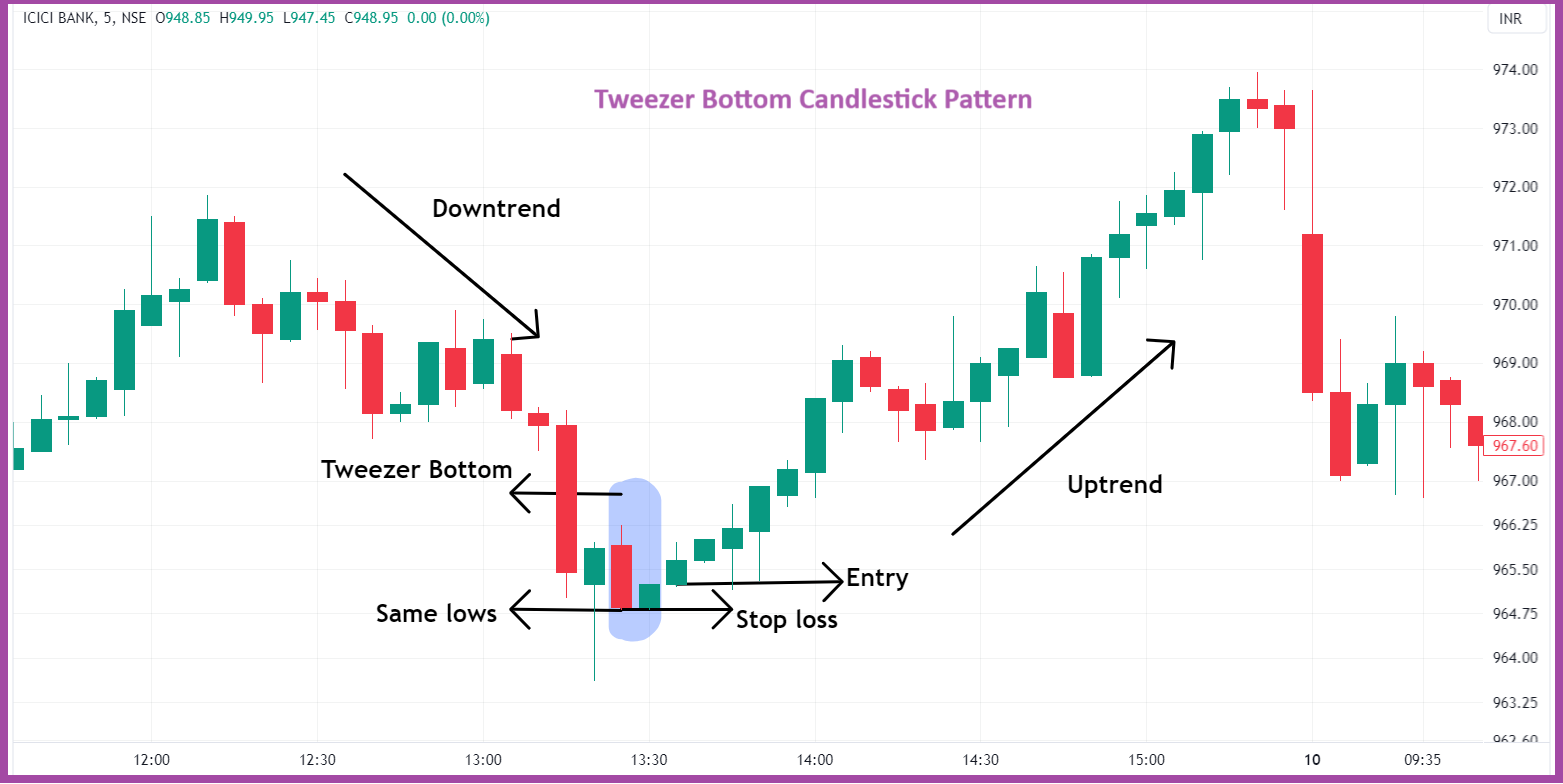
The Tweezer Bottom pattern, also known simply as Tweezer Bottoms, is a dual candlestick pattern that emerges at the end of a downtrend. It is characterized by two candlesticks, with the first being a bearish candlestick and the second being a bullish candlestick, both sharing identical or nearly identical lows. These candlesticks resemble tweezer-like formations, hence the name “Tweezer Bottom.”
Anatomy of the Tweezer Bottom
- First Candlestick (Bearish):
- The first candlestick in the Tweezer Bottom pattern is typically a long bearish candle, reflecting the prevailing downtrend in the market. It signifies significant selling pressure and sets the stage for the potential reversal.
- Second Candlestick (Bullish):
- The second candlestick is a bullish candlestick that immediately follows the bearish candlestick. It opens at or near the low of the previous candle and closes higher, forming a small body with little to no upper shadow. The low of this candle matches or closely matches the low of the preceding bearish candle.
Formation Criteria
For a Tweezer Bottom pattern to be considered valid, it must meet the following criteria:
- The market should be in a downtrend before the pattern occurs.
- The first candle should be a long bearish candle, indicating strong selling pressure.
- The second candle should be a bullish candle with a small body, closing higher than the previous candle’s low, and sharing identical or nearly identical lows with the first candle.
Deciphering the Psychology Behind the Tweezer Bottom
Understanding the psychology behind the Tweezer Bottom pattern is essential for grasping its significance and potential implications. Here’s a breakdown of the psychological dynamics at play:
- Initial Bearish Pressure:
- The first bearish candle represents the dominance of sellers, who drive prices lower, establishing a downtrend. Market sentiment is predominantly bearish at this stage.
- Failed Downward Momentum:
- The appearance of the second bullish candle, with its low matching or closely matching the low of the preceding bearish candle, suggests a failure of the bears to push prices lower. It indicates that selling pressure has diminished or exhausted.
- Emergence of Buying Interest:
- The bullish candle that follows signifies the emergence of buying interest, as buyers step in to support the price near the lows of the previous session. This shift in momentum hints at a potential reversal of the downtrend.
Significance of the Tweezer Bottom in Trading
The Tweezer Bottom pattern holds considerable significance for traders due to several reasons:
- Bullish Reversal Signal:
- The Tweezer Bottom pattern serves as a potent bullish reversal signal, suggesting a potential end to the prevailing downtrend and the onset of an uptrend. Traders interpret this pattern as a signal to enter long positions or exit short positions.
- Confirmation of Trend Reversal:
- The pattern provides confirmation of a trend reversal when observed at the end of a downtrend. It offers traders clarity amidst market uncertainty and assists in making informed trading decisions.
- Market Sentiment Shift:
- The emergence of Tweezer Bottoms indicates a shift in market sentiment from bearish to bullish. It reflects a change in the balance of power between buyers and sellers, potentially leading to sustained upward price movement.
- Versatility Across Timeframes:
- The Tweezer Bottom pattern is applicable across various timeframes, from intraday charts to longer-term charts. This versatility allows traders to identify reversal signals across different trading horizons.
Trading Strategies Involving Tweezer Bottom
Traders can employ several strategies to capitalize on the potential of the Tweezer Bottom pattern:
- Confirmation with Volume:
- Confirm the Tweezer Bottom pattern with an increase in trading volume on the bullish candlestick. Elevated volume provides validation of the pattern and strengthens the bullish reversal signal.
- Support and Resistance Levels:
- Look for Tweezer Bottoms forming near key support levels, as this confluence increases the pattern’s reliability. Similarly, the presence of resistance-turned-support levels enhances the bullish reversal signal.
- Moving Averages:
- Use moving averages to confirm the reversal of the downtrend. When the Tweezer Bottom pattern occurs near a long-term moving average, it reinforces the bullish reversal signal, especially if accompanied by a bullish crossover.
- Entry and Exit Points:
- Enter long positions at the close of the second bullish candle and set stop-loss orders below the low of the Tweezer Bottom pattern. Take profit levels can be set based on resistance levels or using a trailing stop-loss strategy.
Practical Example of Tweezer Bottom
Consider a scenario where a stock has been experiencing a prolonged downtrend, with consecutive bearish candlesticks dominating the price action. Suddenly, a Tweezer Bottom pattern emerges, consisting of a long bearish candle followed by a smaller bullish candle with an identical low. Traders who identify this pattern interpret it as a potential reversal signal and may enter long positions, anticipating a shift in the trend direction.
Pros and Cons of Tweezer Bottom
Pros
- Strong Reversal Signal:
- The Tweezer Bottom pattern is a robust indicator of a potential bullish reversal, providing traders with a clear signal to enter long positions after a downtrend.
- Confirmation of Trend Reversal:
- The pattern offers confirmation of a trend reversal when observed at the end of a downtrend, aiding traders in making informed trading decisions.
- Versatility Across Timeframes:
- The pattern is applicable across various timeframes, allowing traders to identify reversal signals across different trading horizons.
Cons
- Potential for False Signals:
- Like any technical pattern, the Tweezer Bottom may occasionally produce false signals, especially in choppy or volatile markets, leading to premature entries or exits.
- Context Dependency:
- The effectiveness of the pattern depends on its context within the broader market trend and conditions. Traders must consider other technical indicators and market factors to validate the pattern’s significance.
- Risk Management:
- While the pattern provides a clear entry signal, traders must implement proper risk management strategies to mitigate potential losses, including setting stop-loss orders and managing position sizes.
Conclusion
The Tweezer Bottom pattern stands as a formidable tool in the arsenal of technical analysts, offering invaluable insights into potential bullish reversals in the market. Its visual simplicity, coupled with its robustness as a reversal signal, makes it a favorite among traders seeking to identify opportune entry points amidst market uncertainty. By mastering the intricacies of the Tweezer Bottom pattern and integrating it into their trading strategies, traders can enhance their ability to navigate the dynamic landscape of financial markets and capitalize on emerging trends.
EDUBRUG is a top educational institute known for offering the best stock market courses in India. Our goal is to make financial markets easy to understand and help people learn about trading. Eduburg has quickly become a popular choice for those who want to become successful traders and investors. Our experienced faculties, who are certified, provide practical training in stock trading, technical analysis, and financial planning. Eduburg is dedicated to providing high-quality education, ensuring that our students gain the skills and confidence needed to succeed in the stock market.