Bearish Harami Candlestick Pattern: A Comprehensive Guide
Introduction
Please don’t get confused with its name. It’s Japanese language…![]()
One of the notable patterns indicating a possible reversal from bullish to bearish sentiment is the Bearish Harami. This detailed guide will explore what the Bearish Harami pattern is, how it forms, its significance, and how traders can effectively use it in their trading strategies.
What is the Bearish Harami Pattern?
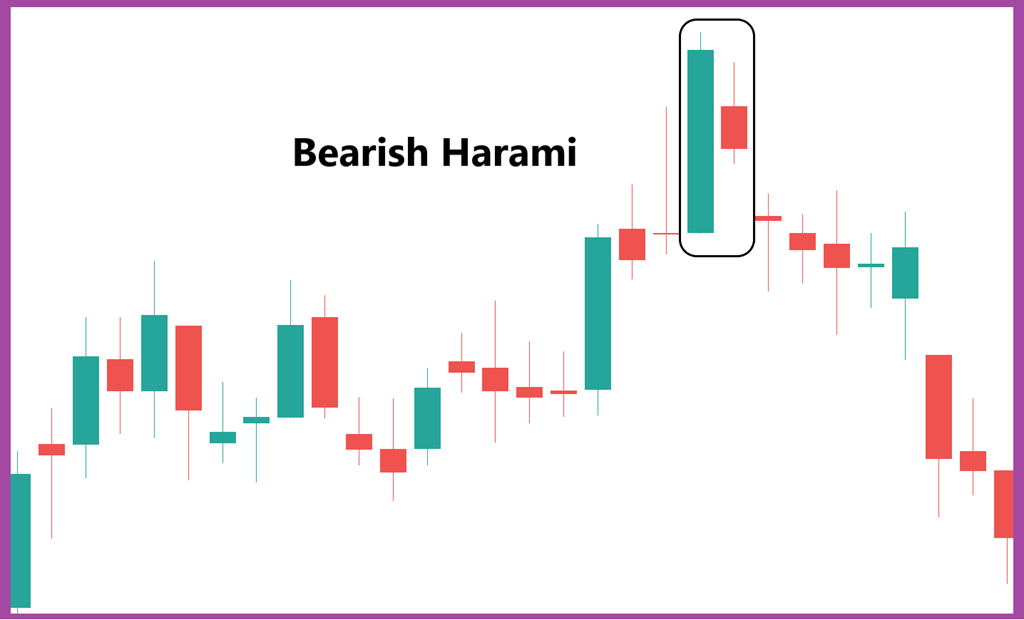
The Bearish Harami is a two-candlestick pattern that appears during an uptrend, signaling a potential bearish reversal. The term “Harami” is derived from a Japanese word meaning “pregnant,” reflecting the pattern’s visual appearance. The pattern consists of the following components:
- First Candlestick (Bullish):
- The first candlestick is a long bullish (green or white) candlestick, indicating strong buying pressure and continuation of the uptrend.
- Second Candlestick (Bearish):
- The second candlestick is a smaller bearish (red or black) candlestick that opens and closes within the body of the first candlestick. This suggests a weakening of the uptrend and potential reversal.
Formation Criteria
For a Bearish Harami pattern to be considered valid, it must meet the following criteria:
- The market should be in an uptrend before the pattern appears.
- The first candlestick should be a long bullish candlestick.
- The second candlestick should be smaller and open and close within the body of the first candlestick.
Psychology Behind the Bearish Harami Pattern
Understanding the psychology behind the Bearish Harami pattern helps traders interpret its significance:
- Bullish Sentiment:
- The pattern starts with a strong bullish candlestick, indicating that buyers are in control and pushing prices higher.
- Indecision or Weakening Momentum:
- The second candlestick shows indecision or a weakening of the upward momentum as it forms within the range of the first candlestick. This suggests that buyers are losing strength and sellers are starting to gain control.
- Potential Bearish Reversal:
- The Bearish Harami pattern indicates that the market may be ready to reverse direction. The smaller bearish candlestick within the larger bullish candlestick’s body signals a potential shift from bullish to bearish sentiment.
Significance of the Bearish Harami Pattern
The Bearish Harami pattern is significant for traders for several reasons:
- Bearish Reversal Signal:
- It serves as a potential bearish reversal signal, suggesting that the uptrend may be coming to an end. Traders use this pattern to prepare for a potential shift to a downtrend.
- Confirmation of Market Sentiment Change:
- The pattern confirms a change in market sentiment from bullish to bearish, helping traders adjust their positions accordingly.
- Entry Point for Traders:
- The Bearish Harami pattern presents an opportunity for traders to enter short positions or exit long positions in anticipation of a potential bearish reversal.
Trading Strategies Using the Bearish Harami Pattern
Here are some strategies to effectively trade using the Bearish Harami pattern:
- Wait for Confirmation:
- Always wait for confirmation before taking a position based on the Bearish Harami pattern. Confirmation typically comes from a subsequent bearish candlestick that closes below the second candlestick of the pattern.
- Combine with Other Indicators:
- Use other technical indicators, such as moving averages, RSI (Relative Strength Index), or MACD (Moving Average Convergence Divergence), to confirm the reversal signal given by the Bearish Harami pattern. This helps increase the reliability of the signal.
- Identify Support and Resistance Levels:
- Identify key support and resistance levels near the Bearish Harami pattern. If the pattern forms near a strong resistance level, it reinforces the likelihood of a trend reversal.
- Set Stop-Loss Orders:
- Use stop-loss orders to manage risk. Place the stop-loss order above the high of the first candlestick to protect against potential false signals.
- Plan Entry and Exit Points:
- Plan your entry and exit points based on the confirmation candle and nearby support levels. This helps in managing trades effectively and maximizing potential profits.
Example of the Bearish Harami Pattern
Consider a stock that has been in an uptrend for several weeks. Here’s how the Bearish Harami pattern might play out:
- Day 1 (Bullish Candlestick):
- The stock opens at $100, moves up during the day, and closes at $110, forming a long bullish candlestick.
- Day 2 (Bearish Candlestick):
- The stock opens at $108, moves slightly during the day, and closes at $105, forming a smaller bearish candlestick within the range of the first candlestick.
The formation of this pattern signals a potential bearish reversal. Traders might enter short positions if the stock continues to show bearish movement in the following days.
Pros and Cons of the Bearish Harami Pattern
Pros
- Clear Reversal Signal:
- The Bearish Harami pattern provides a clear indication of a potential trend reversal, helping traders anticipate and prepare for market changes.
- Confirmation of Sentiment Shift:
- The pattern offers valuable insights into market sentiment, showing that buying pressure is weakening and selling pressure is increasing.
- Strategic Entry Point:
- The pattern presents traders with a strategic entry point to capitalize on the anticipated bearish reversal, facilitating advantageous positioning in the market.
Cons
- Need for Confirmation:
- The Bearish Harami pattern requires confirmation from subsequent candlesticks or technical indicators, which can delay the trading decision and potentially reduce profit margins.
- Potential for False Signals:
- Like any technical pattern, the Bearish Harami can produce false signals, especially in volatile or choppy markets.
- Context Dependency:
- The effectiveness of the Bearish Harami pattern depends on the broader market context and trend. Traders should use it in conjunction with other technical indicators and market analysis.
Practical Considerations for Trading the Bearish Harami Pattern
- Volume Analysis:
- Analyzing volume can add confirmation to the Bearish Harami pattern. Higher volume on the bearish candlestick suggests stronger selling pressure and increases the pattern’s reliability.
- Market Conditions:
- Consider the broader market conditions. The Bearish Harami pattern is more reliable in a clearly defined uptrend. In sideways or choppy markets, the pattern may be less effective.
- Multiple Timeframe Analysis:
- Use multiple timeframes to increase confidence in the pattern. For instance, a Bearish Harami pattern on a daily chart confirmed by bearish signals on a weekly chart adds to the strength of the signal.
- Risk Management:
- Always use proper risk management techniques. The Bearish Harami pattern, like any technical signal, is not foolproof. Protecting your capital with stop-loss orders and position sizing is crucial.
- Combine with Other Technical Tools:
- Enhance the pattern’s effectiveness by combining it with other technical tools such as trendlines, Fibonacci retracements, and momentum indicators. This holistic approach provides a more comprehensive view of market conditions.
Conclusion
The Bearish Harami pattern is a powerful tool for traders looking to identify potential bearish reversals in an uptrend. By understanding its formation, significance, and psychological underpinnings, traders can make more informed decisions and improve their trading strategies. However, it’s essential to use the Bearish Harami pattern in conjunction with other technical indicators and market analysis for confirmation and to mitigate the risk of false signals.
In essence, the Bearish Harami pattern serves as a clear warning that the bullish momentum may be waning and a bearish reversal could be imminent. By practicing patience, diligence, and proper risk management, traders can effectively use this pattern to navigate the complexities of the financial markets and enhance their trading outcomes.
Remember, successful trading involves continuous learning and adaptation. By observing the Bearish Harami pattern in real-market scenarios and refining your approach, you can develop a deeper understanding of market dynamics and position yourself advantageously in your trading endeavors.
EDUBRUG is a top educational institute known for offering the best stock market courses in India. Our goal is to make financial markets easy to understand and help people learn about trading. Eduburg has quickly become a popular choice for those who want to become successful traders and investors. Our experienced faculties, who are certified, provide practical training in stock trading, technical analysis, and financial planning. Eduburg is dedicated to providing high-quality education, ensuring that our students gain the skills and confidence needed to succeed in the stock market.