Mat-Hold Candlestick Pattern: A Comprehensive Guide
Introduction
The Mat-Hold candlestick pattern is a powerful continuation pattern used in technical analysis to predict future price movements. This pattern signals that the prevailing trend, whether bullish or bearish, is likely to continue. Recognizing and understanding the Mat-Hold pattern can help traders make informed decisions about entering or exiting positions. In this article, we will explore the formation, characteristics, interpretation, and practical trading strategies associated with the Mat-Hold candlestick pattern.
Understanding the Mat-Hold Pattern
The Mat-Hold pattern is typically observed in trending markets and can appear as a bullish or bearish continuation pattern. It consists of five candlesticks and is characterized by a period of consolidation that does not disrupt the overall trend.
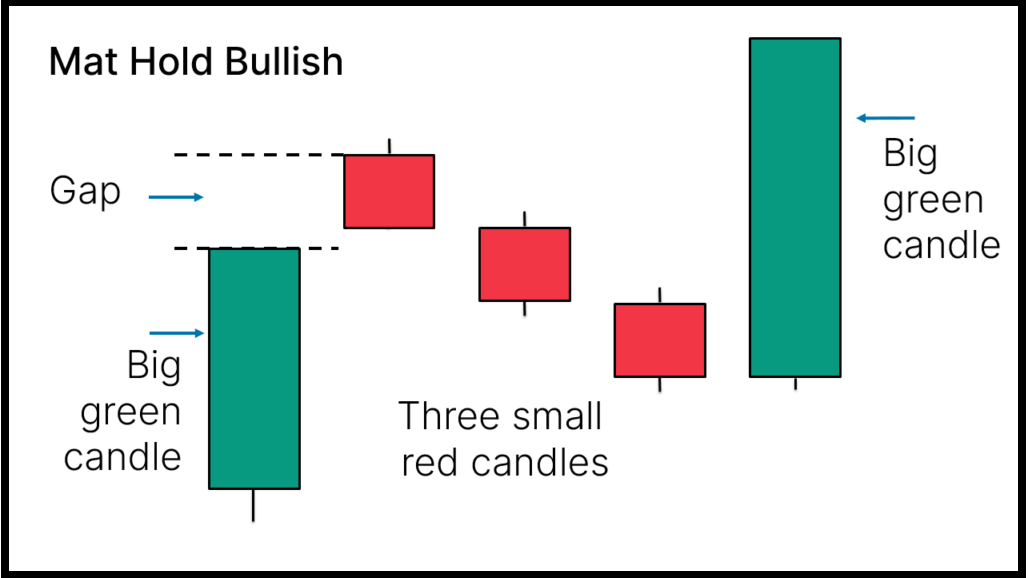
Bullish Mat-Hold Pattern
- First Candlestick: A long bullish (white or green) candlestick that confirms the prevailing uptrend. This candlestick demonstrates strong buying pressure.
- Second to Fourth Candlesticks: A series of smaller candlesticks, often alternating between bullish and bearish, that create a slight pullback or consolidation. These candlesticks usually stay within the range of the first candlestick.
- Fifth Candlestick: A long bullish candlestick that resumes the upward trend and closes above the high of the first candlestick, confirming the continuation of the bullish trend.
Bearish Mat-Hold Pattern
- First Candlestick: A long bearish (black or red) candlestick that confirms the prevailing downtrend. This candlestick demonstrates strong selling pressure.
- Second to Fourth Candlesticks: A series of smaller candlesticks, often alternating between bearish and bullish, that create a slight pullback or consolidation. These candlesticks usually stay within the range of the first candlestick.
- Fifth Candlestick: A long bearish candlestick that resumes the downward trend and closes below the low of the first candlestick, confirming the continuation of the bearish trend.
Formation and Characteristics
The Mat-Hold pattern is formed through the interaction of these five candlesticks:
- First Candlestick: The initial long candlestick confirms the direction of the prevailing trend, showing strong buying or selling pressure.
- Consolidation Phase: The second to fourth candlesticks represent a period of consolidation, where the price moves sideways or slightly against the trend. This phase indicates temporary profit-taking or hesitation among traders but does not signify a trend reversal.
- Continuation: The fifth candlestick resumes the original trend with strong momentum, closing beyond the high or low of the first candlestick, depending on whether the pattern is bullish or bearish.
Interpreting the Mat-Hold Pattern
The Mat-Hold pattern provides insights into market psychology and potential future price movements:
- Continuation Signal: The pattern signals the continuation of the existing trend, helping traders align their strategies with the prevailing market direction.
- Psychological Insight: The consolidation phase within the pattern indicates temporary hesitation or profit-taking. However, the final candlestick demonstrates a renewed commitment to the original trend, confirming that the prevailing sentiment remains intact.
- Strength of Trend: The pattern’s ability to hold the price within the range of the first candlestick during the consolidation phase suggests that the trend is strong and likely to continue.
Practical Trading Strategies
Traders can use the Mat-Hold pattern to develop effective trading strategies. Here are some practical approaches:
- Entering Positions: Traders can enter positions in the direction of the prevailing trend after the formation of the fifth candlestick, anticipating the continuation of the trend.
- Example: In the case of a bullish Mat-Hold pattern, a trader might enter a long position on the day following the formation of the fifth candlestick, expecting the uptrend to continue.
- Stop-Loss Placement: To manage risk, traders can place stop-loss orders below the consolidation phase for bullish patterns or above it for bearish patterns. This helps protect against potential trend reversals.
- Example: For a bullish Mat-Hold pattern, the stop-loss order can be placed below the low of the fourth candlestick to limit potential losses if the trend fails to continue.
- Confirmation with Other Indicators: To reduce the risk of false signals, traders often seek additional confirmation from other technical indicators, such as moving averages, relative strength index (RSI), or volume analysis.
- Example: Before entering a position based on the Mat-Hold pattern, a trader might check if the RSI is above 50 in a bullish pattern, indicating bullish momentum, or if the volume during the formation of the pattern is higher than average, confirming strong buying or selling pressure.
Example of Mat-Hold Pattern in Action
Imagine a stock that has been in a steady uptrend. On Day 1, it forms a long bullish candlestick. On Days 2 to 4, the stock consolidates with smaller candlesticks that stay within the range of Day 1’s candlestick. On Day 5, the stock forms another long bullish candlestick that closes above the high of Day 1, confirming the continuation of the uptrend. This sequence forms a bullish Mat-Hold pattern.
Limitations and Considerations
While the Mat-Hold pattern is a useful continuation pattern, it is essential to consider its limitations:
- Market Conditions: The pattern is most reliable in trending markets. In choppy or sideways markets, its predictive power may be reduced.
- Confirmation Needed: Relying solely on the Mat-Hold pattern without additional confirmation from other indicators or patterns can lead to false signals.
- Time Frame: The pattern’s reliability may vary across different time frames. Traders should consider the context of the overall trend and the specific time frame they are trading.
Conclusion
The Mat-Hold candlestick pattern is a valuable tool for traders looking to capitalize on continued momentum in the market. By understanding its formation, interpretation, and significance, traders can enhance their technical analysis toolkit and make more informed trading decisions. As with all technical analysis tools, it is essential to use the Mat-Hold pattern in conjunction with other indicators and analysis techniques to increase the reliability of trading signals and manage risks effectively.
By mastering the Mat-Hold pattern, traders can better navigate the complexities of financial markets and improve their chances of achieving consistent success.
EDUBRUG is a top educational institute known for offering the best stock market courses in India. Our goal is to make financial markets easy to understand and help people learn about trading. Eduburg has quickly become a popular choice for those who want to become successful traders and investors. Our experienced faculties, who are certified, provide practical training in stock trading, technical analysis, and financial planning. Eduburg is dedicated to providing high-quality education, ensuring that our students gain the skills and confidence needed to succeed in the stock market.