Bullish Engulfing Pattern: A Comprehensive Guide
Introduction
The Bullish Engulfing pattern is a powerful candlestick pattern used by traders to identify potential reversals in a downtrend. This pattern is a key indicator in technical analysis, providing insights into market sentiment and potential future price movements. In this article, we will delve into the anatomy of the Bullish Engulfing pattern, the psychology behind its formation, its significance in trading, and strategies for its effective use.
Anatomy of the Bullish Engulfing Pattern
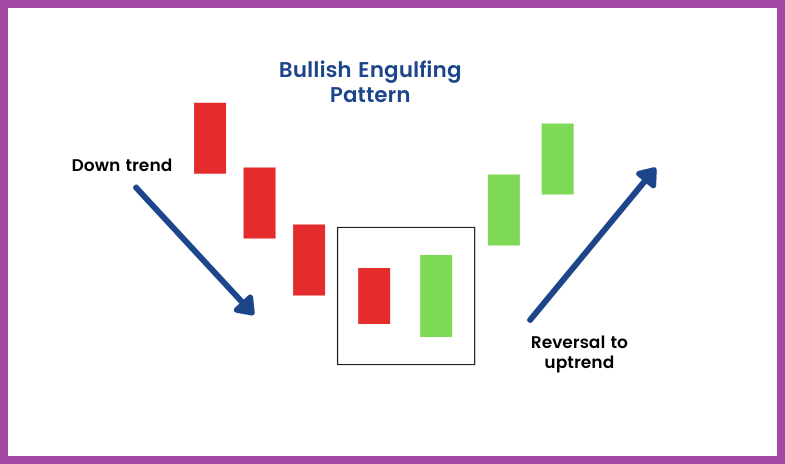
The Bullish Engulfing pattern consists of two candles:
- First Candle (Bearish Candle): This candle is typically a small-bodied bearish candle, indicating that the sellers were in control.
- Second Candle (Bullish Candle): The second candle is a large-bodied bullish candle that completely engulfs the body of the first candle, indicating a significant shift in momentum from sellers to buyers.
The key features of a Bullish Engulfing pattern include:
- The second candle’s body must fully encompass the body of the first candle.
- The shadows (wicks) of the second candle do not necessarily need to engulf the shadows of the first candle, although this can add strength to the pattern.
- The pattern often appears at the bottom of a downtrend, signaling a potential reversal.
Psychology Behind the Bullish Engulfing Pattern
The Bullish Engulfing pattern reflects a shift in market sentiment. Here’s the psychological journey behind its formation:
- Downtrend Continuation: The market is in a downtrend, with bearish sentiment dominating.
- Small Bearish Candle: The first candle forms, continuing the downtrend. Sellers maintain control, but the candle’s small body suggests weakening selling pressure.
- Strong Bullish Reversal: The second candle opens lower but then surges higher, closing above the previous candle’s open. This indicates that buyers have overwhelmed sellers, reversing the trend.
This dramatic shift from bearish to bullish sentiment suggests that buyers are gaining confidence and that the downtrend may be coming to an end.
Significance of Bullish Engulfing in Trading
The Bullish Engulfing pattern is significant for several reasons:
- Trend Reversal Indicator: It is a strong indicator of a potential reversal from a downtrend to an uptrend, providing traders with an opportunity to enter long positions.
- Market Sentiment Shift: It signifies a clear shift in market sentiment, from bearish to bullish, often leading to significant price movements.
- Enhanced by Volume: The pattern’s reliability increases when accompanied by high trading volume, indicating strong participation by buyers.
Trading Strategies Involving Bullish Engulfing
To effectively trade using the Bullish Engulfing pattern, traders should consider the following strategies:
- Confirmation with Follow-Up Candles:
- Strategy: Wait for the next candle to confirm the reversal. A bullish candle following the Bullish Engulfing pattern strengthens the reversal signal.
- Example: After identifying a Bullish Engulfing pattern, observe the next candle. If it is bullish, consider entering a long position.
- Support and Resistance Levels:
- Strategy: Use the Bullish Engulfing pattern in conjunction with support and resistance levels. A Bullish Engulfing pattern near a significant support level adds strength to the reversal signal.
- Example: Identify a Bullish Engulfing pattern forming near a historical support level. This confluence increases the likelihood of a successful trade.
- Volume Analysis:
- Strategy: Confirm the Bullish Engulfing pattern with volume analysis. A higher volume on the second candle suggests strong buyer interest and adds credibility to the pattern.
- Example: If the second candle of the Bullish Engulfing pattern is accompanied by a spike in volume, it indicates strong buying pressure, enhancing the reversal signal.
- Moving Averages:
- Strategy: Use moving averages to identify the overall trend direction. A Bullish Engulfing pattern that forms above a key moving average, like the 50-day or 200-day moving average, is a stronger signal.
- Example: If a Bullish Engulfing pattern appears above the 50-day moving average, consider it a more reliable signal for entering a long position.
Practical Example of Bullish Engulfing Pattern
Consider a stock that has been in a downtrend, with consecutive bearish candles. On a particular day, the stock forms a small bearish candle, followed by a large bullish candle that completely engulfs the previous candle’s body. This forms a Bullish Engulfing pattern. The next day, the stock opens higher and continues to rise, confirming the reversal. Accompanied by high trading volume and forming near a support level, this Bullish Engulfing pattern provides a strong buy signal.
Pros and Cons of the Bullish Engulfing Pattern
Pros
- Strong Reversal Signal:
- Pro: The Bullish Engulfing pattern is a powerful indicator of a potential trend reversal. Its clear shift from bearish to bullish sentiment can provide a strong signal that the downtrend may be ending and an uptrend might be starting.
- Easy Identification:
- Pro: The pattern is relatively easy to identify on a candlestick chart. The large bullish candle engulfing the previous bearish candle’s body makes it visually distinctive, even for novice traders.
- Confirmation of Market Sentiment Shift:
- Pro: This pattern clearly indicates a shift in market sentiment from sellers to buyers. It reflects a significant increase in buying pressure, which can help traders make informed decisions.
- Enhanced Reliability with Volume:
- Pro: When the Bullish Engulfing pattern is accompanied by high trading volume, its reliability as a reversal signal increases. High volume indicates strong participation by buyers, reinforcing the pattern’s significance.
- Applicability Across Markets:
- Pro: The Bullish Engulfing pattern can be used in various financial markets, including stocks, forex, commodities, and cryptocurrencies. Its principles are universal, making it a versatile tool for traders.
Cons
- Requires Confirmation:
- Con: A single Bullish Engulfing pattern does not guarantee a trend reversal. Traders need to look for additional confirmation from subsequent price action or other technical indicators to validate the signal and avoid false positives.
- Potential for False Signals:
- Con: Like any technical pattern, the Bullish Engulfing pattern can sometimes produce false signals, especially in volatile or choppy markets. This can lead to premature entries or exits from trades.
- Context Dependence:
- Con: The pattern’s effectiveness depends on the context within the broader market trend and conditions. Without considering the overall trend and other technical factors, traders might misinterpret the pattern.
- Limited Predictive Power in Isolation:
- Con: While the Bullish Engulfing pattern indicates a potential reversal, it does not provide information about the extent or duration of the new trend. It should be used as part of a broader analysis rather than in isolation.
- Overlapping with Other Patterns:
- Con: The Bullish Engulfing pattern may sometimes overlap with other candlestick patterns, leading to conflicting signals. Traders need to be cautious and use additional indicators to clarify the trading signal.
The Bullish Engulfing pattern is a valuable tool in technical analysis, offering clear signals of potential trend reversals from downtrends to uptrends. Its ease of identification and applicability across various markets make it a popular choice among traders. However, like any trading tool, it has its limitations. The pattern requires confirmation from additional indicators and analysis to mitigate the risk of false signals and ensure more accurate trading decisions. By understanding the pros and cons of the Bullish Engulfing pattern, traders can effectively incorporate it into their trading strategies for better outcomes.
Conclusion
The Bullish Engulfing pattern is a reliable and powerful tool in technical analysis, offering traders insights into potential trend reversals and shifts in market sentiment. By understanding its formation, psychology, and significance, and by combining it with other technical indicators and strategies, traders can enhance their ability to identify profitable trading opportunities. However, it’s essential to confirm the pattern with additional analysis to mitigate the risk of false signals and ensure successful trading outcomes.
EDUBRUG is a top educational institute known for offering the best stock market courses in India. Our goal is to make financial markets easy to understand and help people learn about trading. Eduburg has quickly become a popular choice for those who want to become successful traders and investors. Our experienced faculties, who are certified, provide practical training in stock trading, technical analysis, and financial planning. Eduburg is dedicated to providing high-quality education, ensuring that our students gain the skills and confidence needed to succeed in the stock market.