Comprehensive Guide to Candlestick Chart & Patterns in the Stock Market
I. Introduction
Candlestick charts are an essential tool in technical analysis for traders and investors. Originating from Japan, candlestick charts provide a visual representation of price movements over specific periods, offering insights into market sentiment and potential future price action. This comprehensive guide will delve into the history, structure, key patterns, advanced techniques, and practical applications of candlestick charts, providing a thorough understanding for anyone interested in mastering this powerful analytical tool.
II. Historical Background of Candlestick Charts
2.1 Origins in Japan
Candlestick charting was developed in the 18th century by Japanese rice trader Munehisa Homma. Homma’s observations and record-keeping laid the groundwork for modern candlestick analysis. His techniques allowed him to predict future rice prices by examining past price movements and patterns.
2.2 Introduction to the Western World
Steve Nison, a prominent technical analyst, introduced candlestick charting to the Western world in the late 20th century. His book, “Japanese Candlestick Charting Techniques,” published in 1991, brought widespread attention to this form of technical analysis. Since then, candlestick charts have become a standard tool in the arsenal of traders and investors globally.
III. Structure and Interpretation of Candlestick Charts
3.1 Basic Components
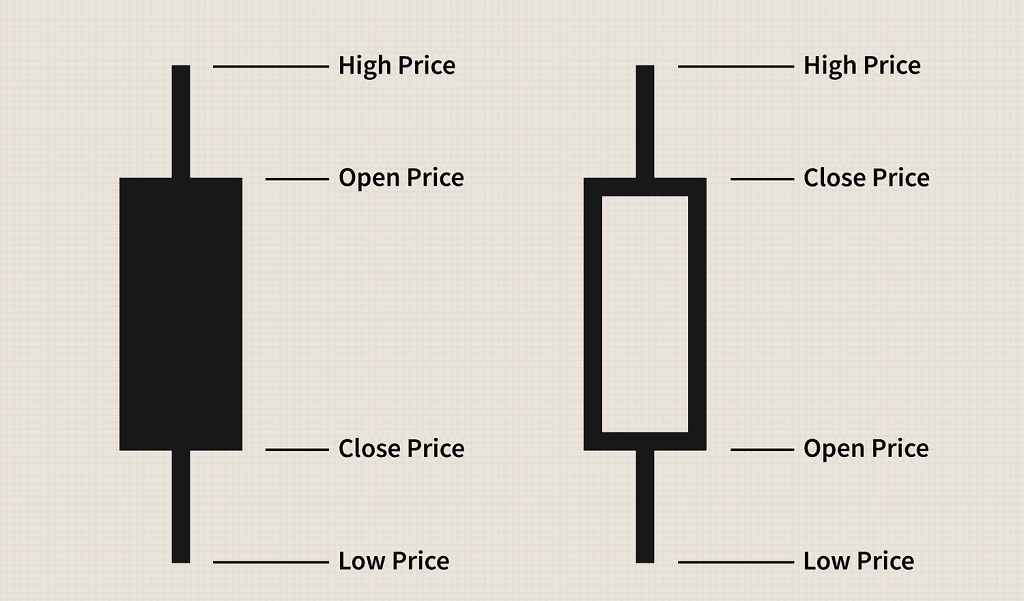
Candlesticks are composed of a body and wicks (or shadows). The body represents the range between the opening and closing prices during a specific period, while the wicks show the highest and lowest prices reached.
- Body: The filled or hollow section of the candlestick, indicating the range between the opening and closing prices.
- Wicks: Thin lines extending from the top and bottom of the body, representing the high and low prices.
- Color: Typically, a bullish candlestick (price closed higher than it opened) is shown in green or white, while a bearish candlestick (price closed lower than it opened) is shown in red or black.
3.2 Types of Candlesticks
- Bullish Candlestick: Indicates that the closing price was higher than the opening price, suggesting upward momentum.
- Bearish Candlestick: Indicates that the closing price was lower than the opening price, suggesting downward momentum.
- Doji: A candlestick with little to no body, indicating indecision in the market. The opening and closing prices are very close or identical.
IV. Key Candlestick Patterns
Candlestick patterns are formations created by one or more candlesticks. They are used to predict future price movements based on historical data.
4.1 Single-Candlestick Patterns
- Hammer: A bullish reversal pattern with a small body and a long lower wick, occurring after a downtrend.
- Hanging Man: A bearish reversal pattern similar in appearance to the hammer but occurs after an uptrend.
- Doji: Represents indecision in the market. Depending on its location in the chart, it can signal a potential reversal.
4.2 Double-Candlestick Patterns
- Engulfing Pattern: Consists of two candlesticks. In a bullish engulfing pattern, a small bearish candlestick is followed by a larger bullish candlestick that engulfs the previous one. A bearish engulfing pattern is the opposite.
- Harami: A two-candlestick pattern where a large candlestick is followed by a smaller one that is contained within the body of the first. A bullish harami occurs in a downtrend, while a bearish harami occurs in an uptrend.
4.3 Triple-Candlestick Patterns
- Morning Star: A bullish reversal pattern consisting of a long bearish candlestick, a small-bodied candlestick (star), and a long bullish candlestick. It indicates the end of a downtrend.
- Evening Star: A bearish reversal pattern that is the opposite of the morning star, indicating the end of an uptrend.
- Three White Soldiers: A bullish pattern consisting of three consecutive long bullish candlesticks with small or no wicks, indicating strong buying pressure.
- Three Black Crows: A bearish pattern consisting of three consecutive long bearish candlesticks with small or no wicks, indicating strong selling pressure.
V. Advanced Techniques in Candlestick Analysis
5.1 Combining Candlestick Patterns with Technical Indicators
- Moving Averages: Using moving averages with candlestick patterns can help confirm trends and reversals. For example, a bullish engulfing pattern above a key moving average can be a strong buy signal.
- Relative Strength Index (RSI): The RSI can indicate overbought or oversold conditions, which, when combined with candlestick patterns, can provide powerful trading signals.
- Volume Analysis: Analyzing volume along with candlestick patterns helps confirm the strength of price movements. High volume during a bullish reversal pattern like a hammer adds credibility to the signal.
5.2 Multiple Time Frame Analysis
Analyzing candlestick patterns across different time frames can provide a more comprehensive view of market trends and potential reversals. For instance, a bullish pattern on a daily chart confirmed by a similar pattern on a weekly chart can increase the reliability of the signal.
5.3 Integrating Candlestick Patterns with Support and Resistance Levels
Support and resistance levels are critical in technical analysis. Candlestick patterns that form near these levels can offer significant trading signals. For example, a bullish engulfing pattern at a strong support level may indicate a strong buying opportunity.
VI. Practical Applications of Candlestick Chart Analysis
6.1 Identifying Trends
Candlestick charts help traders identify the direction of prevailing trends and assess the strength of bullish or bearish momentum. This can be crucial for making informed trading decisions.
6.2 Entry and Exit Points
Traders use candlestick patterns to identify potential entry and exit points for trades. For example, a bullish reversal pattern may signal a good entry point, while a bearish reversal pattern can indicate an exit point.
6.3 Risk Management
Candlestick analysis assists traders in placing stop-loss orders below support levels (for long positions) or above resistance levels (for short positions) to limit potential losses. This is a crucial aspect of risk management in trading.
6.4 Confirmation of Signals
Candlestick patterns serve as confirmation signals for other technical indicators and trading strategies, enhancing their reliability and effectiveness. This multi-faceted approach can improve the accuracy of trading decisions.
VII. Case Studies: Practical Application of Candlestick Chart Analysis
7.1 Bullish Reversal in ABC Corp.
- Background: ABC Corp. has been in a downtrend for several weeks.
- Candlestick Pattern: A bullish engulfing pattern forms on the daily chart, with the second candlestick engulfing the body of the first.
- Additional Analysis: The pattern occurs near a significant support level, and the RSI indicates oversold conditions.
- Outcome: The stock price reverses and begins an upward trend, validating the bullish reversal signal.
7.2 Bearish Continuation in XYZ Ltd.
- Background: XYZ Ltd. is experiencing a downtrend.
- Candlestick Pattern: A bearish flag pattern forms on the hourly chart, followed by a bearish engulfing pattern.
- Additional Analysis: High volume accompanies the bearish engulfing pattern, confirming strong selling pressure.
- Outcome: The stock continues its downward trend, providing a profitable short-selling opportunity for traders.
7.3 Trend Reversal in DEF Inc.
- Background: DEF Inc. has been in an uptrend but shows signs of weakening momentum.
- Candlestick Pattern: An evening star pattern forms on the weekly chart.
- Additional Analysis: The pattern is confirmed by a bearish divergence in the MACD indicator.
- Outcome: The stock reverses direction and enters a downtrend, highlighting the effectiveness of the evening star pattern in predicting trend reversals.
VIII. Conclusion
Candlestick chart analysis is a powerful tool that provides traders and investors with valuable insights into market trends, sentiment shifts, and potential trading opportunities. By understanding the fundamental principles, key patterns, advanced techniques, and practical applications of candlestick chart analysis, traders can enhance their decision-making process, improve their trading strategies, and navigate the complexities of the stock market with confidence and precision.
The journey from the origins of candlestick charting in Japan to its widespread adoption in modern financial markets underscores the enduring value of this analytical technique. Whether you are a novice trader looking to build a strong foundation or an experienced investor seeking to refine your strategies, mastering candlestick chart analysis can significantly enhance your trading performance and investment outcomes.
IX. References
To further explore the concepts discussed in this article, the following references and resources are recommended:
- Nison, Steve. “Japanese Candlestick Charting Techniques.” Prentice Hall Press, 1991.
- Bulkowski, Thomas N. “Encyclopedia of Candlestick Charts.” Wiley Trading, 2008.
- Murphy, John J. “Technical Analysis of the Financial Markets: A Comprehensive Guide to Trading Methods and Applications.” New York Institute of Finance, 1999.
- Pring, Martin J. “Technical Analysis Explained: The Successful Investor’s Guide to Spotting Investment Trends and Turning Points.” McGraw-Hill Education, 2002.
- Achelis, Steven B. “Technical Analysis from A to Z.” McGraw-Hill Education, 2000.
These resources provide in-depth explanations, examples, and practical guidance on candlestick chart analysis and other technical analysis techniques, helping you further refine your trading skills and strategies.
EDUBRUG is a top educational institute known for offering the best stock market courses in India. Our goal is to make financial markets easy to understand and help people learn about trading. Eduburg has quickly become a popular choice for those who want to become successful traders and investors. Our experienced faculties, who are certified, provide practical training in stock trading, technical analysis, and financial planning. Eduburg is dedicated to providing high-quality education, ensuring that our students gain the skills and confidence needed to succeed in the stock market.