Understanding the Dark Cloud Cover Candlestick Pattern: A Comprehensive Guide
Introduction
In technical analysis, candlestick patterns are pivotal tools that help traders predict potential market movements. The Dark Cloud Cover pattern is a significant bearish reversal pattern that traders use to identify potential changes in market direction. This detailed guide will explain what the Dark Cloud Cover pattern is, how it forms, its significance, and how traders can incorporate it into their trading strategies.
What is the Dark Cloud Cover Pattern?
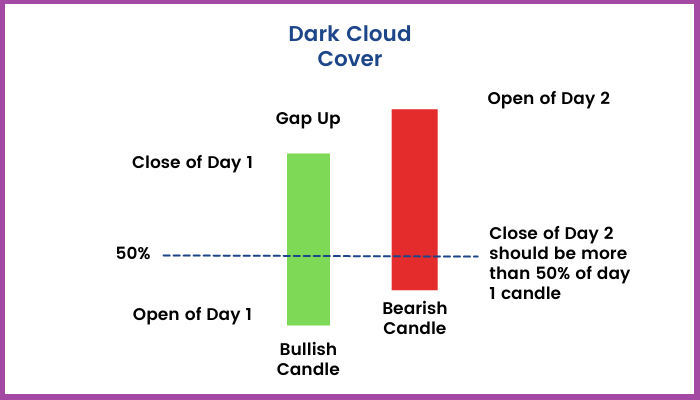
The Dark Cloud Cover pattern is a two-candlestick pattern that appears at the end of an uptrend, signaling a potential bearish reversal. The pattern consists of the following components:
- First Candlestick (Bullish):
- The first candlestick is a long bullish (green or white) candlestick, indicating strong buying pressure and continuation of the uptrend.
- Second Candlestick (Bearish):
- The second candlestick is a bearish (red or black) candlestick that opens above the high of the first candlestick but closes below the midpoint of the first candlestick’s real body.
Formation Criteria
For a Dark Cloud Cover pattern to be considered valid, it must meet the following criteria:
- The market should be in an uptrend before the pattern occurs.
- The first candle should be a long bullish candlestick.
- The second candle should open above the high of the first candlestick.
- The second candle should close below the midpoint of the first candlestick’s real body, showing a strong shift in momentum from bullish to bearish.
Psychology Behind the Dark Cloud Cover Pattern
Understanding the psychology behind the Dark Cloud Cover pattern is crucial for interpreting its significance:
- Bullish Sentiment:
- The pattern starts with a strong bullish candlestick, indicating that buyers are in control and pushing prices higher.
- Bearish Reversal:
- The second candlestick opens above the high of the first, suggesting that the bullish sentiment might continue. However, it closes below the midpoint of the first candlestick, showing that sellers have taken control, creating a shift from bullish to bearish sentiment.
- Market Warning:
- The pattern signals a warning to traders that the uptrend may be weakening, and a bearish reversal could be imminent.
Significance of the Dark Cloud Cover Pattern
The Dark Cloud Cover pattern is significant for traders for several reasons:
- Bearish Reversal Signal:
- It serves as a bearish reversal signal, indicating that the uptrend may be coming to an end. Traders use this pattern to prepare for a potential shift to a downtrend.
- Confirmation of Market Sentiment Change:
- The pattern confirms a change in market sentiment from bullish to bearish, helping traders adjust their positions accordingly.
- Versatility Across Timeframes:
- The Dark Cloud Cover pattern can be applied across various timeframes, from daily charts to longer-term charts, making it a versatile tool for different trading strategies.
Trading Strategies Using the Dark Cloud Cover Pattern
Here are some strategies to effectively trade using the Dark Cloud Cover pattern:
- Wait for Confirmation:
- Always wait for confirmation before taking a position based on the Dark Cloud Cover pattern. Confirmation typically comes from a subsequent bearish candlestick that closes below the second candlestick of the pattern.
- Combine with Other Indicators:
- Use other technical indicators, such as moving averages, RSI (Relative Strength Index), or MACD (Moving Average Convergence Divergence), to confirm the reversal signal given by the Dark Cloud Cover pattern. This helps increase the reliability of the signal.
- Identify Support and Resistance Levels:
- Identify key support and resistance levels near the Dark Cloud Cover pattern. If the pattern forms near a strong resistance level, it reinforces the likelihood of a trend reversal.
- Set Stop-Loss Orders:
- Use stop-loss orders to manage risk. Place the stop-loss order above the high of the second candlestick to protect against potential false signals.
- Plan Entry and Exit Points:
- Plan your entry and exit points based on the confirmation candle and nearby support levels. This helps in managing trades effectively and maximizing potential profits.
Example of the Dark Cloud Cover Pattern
Imagine a stock that has been trending upwards for several weeks. One day, a long bullish candlestick forms, followed by a bearish candlestick that opens above the previous day’s high but closes below the midpoint of the bullish candlestick. This forms a Dark Cloud Cover pattern. The next day, another bearish candlestick forms and closes lower, confirming the bearish reversal. Traders seeing this confirmation might enter short positions, expecting the price to decline.
Pros and Cons of the Dark Cloud Cover Pattern
Pros
- Clear Reversal Signal:
- The Dark Cloud Cover pattern provides a clear indication of a potential trend reversal, helping traders anticipate and prepare for market changes.
- Confirmation of Sentiment Shift:
- The pattern offers valuable insights into market sentiment, showing that buying pressure is weakening and selling pressure is increasing.
- Versatile Application:
- The pattern can be used across various timeframes and in different markets, making it suitable for various trading strategies.
Cons
- Need for Confirmation:
- The Dark Cloud Cover pattern requires confirmation from subsequent candlesticks, which can delay the trading decision and potentially reduce profit margins.
- Potential for False Signals:
- Like any technical pattern, the Dark Cloud Cover can produce false signals, especially in volatile or choppy markets.
- Context Dependency:
- The effectiveness of the Dark Cloud Cover pattern depends on the broader market context and trend. Traders should use it in conjunction with other technical indicators and market analysis.
Conclusion
The Dark Cloud Cover pattern is a valuable tool for traders looking to identify potential bearish reversals in an uptrend. By understanding its formation, significance, and psychological underpinnings, traders can make more informed decisions about their trading strategies. However, it’s essential to use the Dark Cloud Cover pattern in conjunction with other technical indicators and to wait for confirmation before taking action.
In essence, the Dark Cloud Cover pattern serves as an early warning signal, suggesting that the bullish momentum might be waning and a reversal could be on the horizon. By practicing patience, diligence, and proper risk management, traders can effectively use this pattern to navigate the complexities of the financial markets and improve their trading outcomes.
Remember, successful trading involves continuous learning and adaptation. By observing the Dark Cloud Cover pattern in real-market scenarios and refining your approach, you can enhance your ability to anticipate market movements and position yourself advantageously in your trading endeavors.
EDUBRUG is a top educational institute known for offering the best stock market courses in India. Our goal is to make financial markets easy to understand and help people learn about trading. Eduburg has quickly become a popular choice for those who want to become successful traders and investors. Our experienced faculties, who are certified, provide practical training in stock trading, technical analysis, and financial planning. Eduburg is dedicated to providing high-quality education, ensuring that our students gain the skills and confidence needed to succeed in the stock market.