Doji Candlestick Pattern: Introduction
The Doji candlestick pattern is a crucial tool in technical analysis for traders and investors, providing valuable insights into market sentiment and potential price reversals. Recognized by its distinct structure, a Doji signifies indecision in the market and is often a precursor to significant price movements. This article will explore the anatomy of the Doji candlestick, its various types, the psychology behind its formation, and strategies for its effective use in trading.
Anatomy of a Doji Candlestick
A Doji candlestick is characterized by having almost the same opening and closing prices, resulting in a very small or non-existent body. The length of the shadows (wicks) can vary, but the key feature is the thin or non-existent real body. This pattern indicates a balance between supply and demand, leading to indecision among market participants.
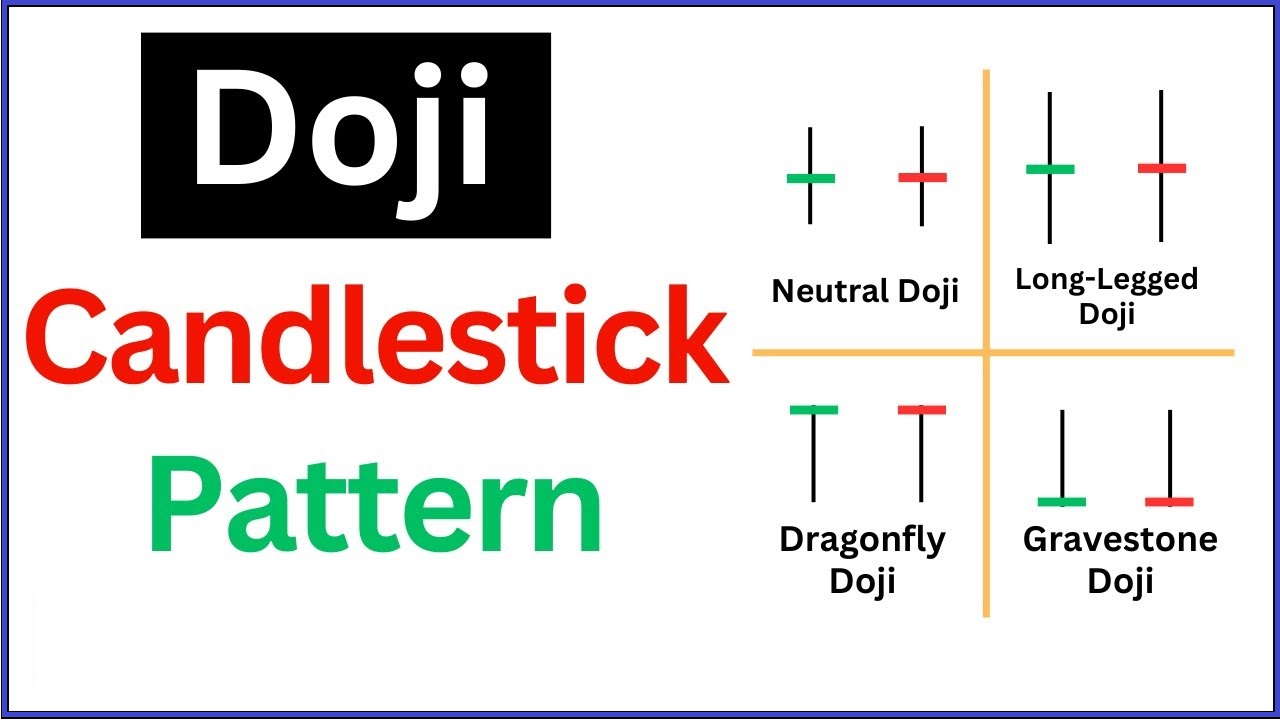
Types of Doji Candlesticks
There are several variations of the Doji candlestick, each providing different insights into market conditions:
- Standard Doji:
- Description: The opening and closing prices are nearly identical, with the shadows extending above and below the body.
- Implication: Indicates indecision in the market.
- Long-Legged Doji:
- Description: Features long shadows both above and below the small body.
- Implication: Highlights significant indecision with sharp price movements in both directions before closing near the open.
- Gravestone Doji:
- Description: The opening and closing prices are at the low of the day, resulting in a long upper shadow.
- Implication: Often seen as a bearish reversal signal, particularly after an uptrend.
- Dragonfly Doji:
- Description: The opening and closing prices are at the high of the day, producing a long lower shadow.
- Implication: Usually a bullish reversal signal when it appears after a downtrend.
- Four-Price Doji:
- Description: Extremely rare, this Doji shows that the open, close, high, and low are all the same.
- Implication: Indicates extreme indecision and a complete lack of direction in the market.
Psychology Behind Doji Formation
The Doji pattern represents a tug-of-war between buyers and sellers. When the market opens, bulls may try to push prices higher, while bears attempt to drag prices lower. By the end of the trading period, the prices revert to or near the opening level, demonstrating an equilibrium between buying and selling pressures. This equilibrium suggests that neither side has gained control, often leading to anticipation of a breakout or a reversal.
Significance of Doji in Trading
The Doji is a powerful signal for traders, especially when it appears in conjunction with other technical indicators and patterns. Its significance is heightened in the following contexts:
- Trend Reversals:
- In an uptrend, a Doji might suggest that the bullish momentum is weakening, potentially leading to a reversal or consolidation.
- In a downtrend, a Doji can indicate seller exhaustion and the possibility of a bullish reversal.
- Support and Resistance Levels:
- The presence of a Doji at key support or resistance levels reinforces the importance of these levels and the likelihood of a reversal or breakout.
- Volume Confirmation:
- High trading volume accompanying a Doji can strengthen the signal, indicating significant market interest and the potential for a strong move following the Doji.
Trading Strategies Involving Doji
To effectively use Doji patterns in trading, it’s essential to combine them with other technical analysis tools and indicators:
- Confirmation with Follow-Up Candles:
- A Doji alone is not sufficient to make a trading decision. Wait for the next candle to confirm the potential reversal or continuation. For instance, a bullish candle following a Dragonfly Doji in a downtrend provides a stronger buy signal.
- Using Moving Averages:
- Combining Doji patterns with moving averages can help identify the overall trend direction. A Doji appearing near a moving average could signal a bounce or break, depending on the trend context.
- Support and Resistance Breakouts:
- Monitor Doji patterns at significant support or resistance levels. A breakout from these levels following a Doji can signal a strong move in the direction of the breakout.
- Volume Analysis:
- Volume spikes accompanying a Doji can indicate strong market participation and validate the potential for a significant price movement.
Conclusion
The Doji candlestick pattern is a versatile and essential tool for traders, offering insights into market indecision and potential reversals. By understanding its formation, variations, and the psychology behind it, traders can make informed decisions and enhance their trading strategies. Combining Doji patterns with other technical indicators and analysis methods can significantly improve the accuracy of predictions and lead to more successful trading outcomes.
EDUBRUG is a top educational institute known for offering the best stock market courses in India. Our goal is to make financial markets easy to understand and help people learn about trading. Eduburg has quickly become a popular choice for those who want to become successful traders and investors. Our experienced faculties, who are certified, provide practical training in stock trading, technical analysis, and financial planning. Eduburg is dedicated to providing high-quality education, ensuring that our students gain the skills and confidence needed to succeed in the stock market.