Downside Tasuki Gap Candlestick Pattern: A Comprehensive Guide
Introduction
The Downside Tasuki Gap is a powerful continuation candlestick pattern used in technical analysis to predict future price movements within a bearish trend. Recognizing this pattern can help traders make more informed decisions about entering short positions or managing existing trades. This article will delve into the intricacies of the Downside Tasuki Gap, exploring its formation, interpretation, significance, and practical trading strategies.
Understanding the Downside Tasuki Gap
The Downside Tasuki Gap pattern consists of three candlesticks and appears within a downtrend, signaling the continuation of the bearish movement. Here’s how to identify it:
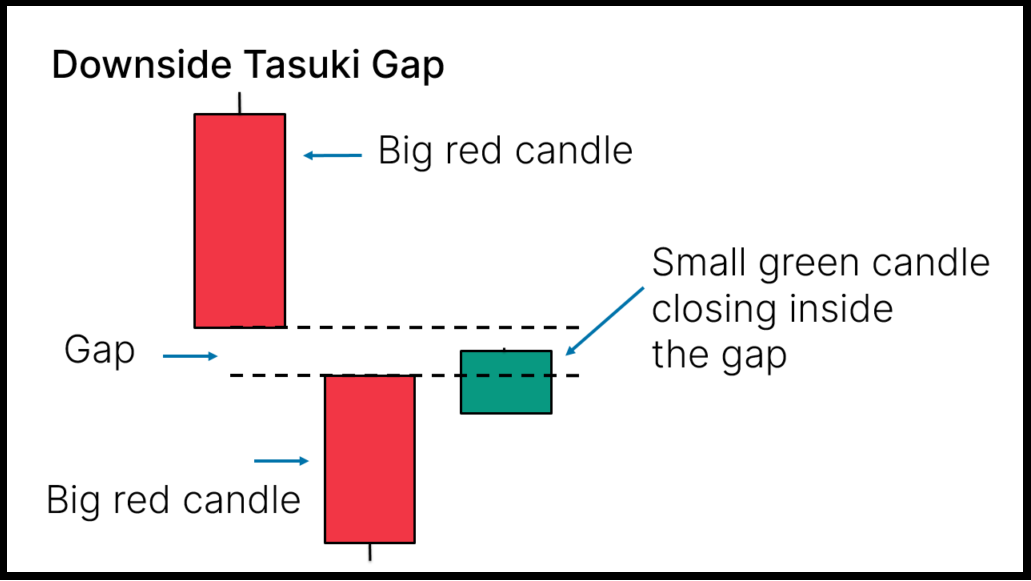
- First Candlestick: A long bearish (black or red) candlestick that continues the prevailing downtrend. This candlestick demonstrates strong selling pressure.
- Second Candlestick: Another bearish candlestick that opens below the close of the first candlestick, creating a gap down. This reinforces the bearish sentiment in the market.
- Third Candlestick: A bullish (white or green) candlestick that opens within the body of the second candlestick and closes within the gap created between the first and second candlesticks but fails to close the gap entirely.
Formation and Components
The Downside Tasuki Gap pattern is formed through the interaction of these three candlesticks:
- Gap Down: The gap down between the first and second candlesticks signifies heightened bearish sentiment, with sellers overwhelming buyers.
- Attempted Recovery: The third candlestick represents an attempt by buyers to push prices higher and close the gap. However, their failure to do so indicates that the selling pressure remains dominant.
Interpreting the Downside Tasuki Gap
The Downside Tasuki Gap pattern provides insights into market psychology and potential future price movements:
- First Candlestick: The initial long bearish candlestick confirms the downtrend, showing that sellers are firmly in control.
- Second Candlestick: The gap down followed by another bearish candlestick suggests a continuation of strong selling pressure and a lack of buying interest.
- Third Candlestick: The bullish candlestick indicates a brief rally by buyers. However, the inability to close the gap signals that sellers are still in control, and the downtrend is likely to continue.
Significance in Trading
The Downside Tasuki Gap is significant for several reasons:
- Continuation Signal: It signals the continuation of the existing downtrend, helping traders align their strategies with the prevailing market direction.
- Psychological Insight: The pattern provides insights into market psychology, highlighting the dominance of sellers and the failure of buyers to reverse the trend.
- Risk Management: Recognizing this pattern can help traders manage risk by confirming bearish trends and identifying potential entry and exit points.
Practical Trading Strategies
Traders can use the Downside Tasuki Gap pattern to develop effective trading strategies. Here are some practical approaches:
- Entering Short Positions: Traders can enter short positions after the formation of the third candlestick, anticipating the continuation of the downtrend. The inability of the third candlestick to close the gap confirms the bearish sentiment.
- Example: If a stock shows a Downside Tasuki Gap pattern, a trader might sell the stock short on the day following the formation of the third candlestick.
- Stop-Loss Placement: A stop-loss order can be placed above the gap to manage risk. A close above the gap might indicate a potential reversal or weakening of the bearish trend.
- Example: In the previous scenario, the trader could place a stop-loss order above the high of the second candlestick to limit potential losses.
- Confirmation with Other Indicators: To reduce the risk of false signals, traders often seek additional confirmation from other technical indicators, such as moving averages, relative strength index (RSI), or volume analysis.
- Example: Before entering a short position based on the Downside Tasuki Gap, a trader might check if the RSI is below 50, indicating bearish momentum, or if the volume during the formation of the pattern is higher than average, confirming strong selling pressure.
Example of Downside Tasuki Gap in Action
Imagine a stock that has been in a steady downtrend. On Day 1, it forms a long bearish candlestick. On Day 2, it opens lower, creating a gap, and closes lower again with another bearish candlestick. On Day 3, it opens within the body of Day 2’s candlestick and closes higher but still within the gap created between Day 1 and Day 2. This sequence forms the Downside Tasuki Gap pattern, signaling the likely continuation of the downtrend.
Limitations and Considerations
While the Downside Tasuki Gap is a useful pattern, it is essential to consider its limitations:
- Market Conditions: The pattern is most reliable in trending markets. In choppy or sideways markets, its predictive power may be reduced.
- Confirmation Needed: Relying solely on the Downside Tasuki Gap without additional confirmation from other indicators or patterns can lead to false signals.
- Time Frame: The pattern’s reliability may vary across different time frames. Traders should consider the context of the overall trend and the specific time frame they are trading.
Conclusion
The Downside Tasuki Gap is a valuable pattern for traders looking to capitalize on continued bearish momentum in the market. By understanding its formation, interpretation, and significance, traders can enhance their technical analysis toolkit and make more informed trading decisions. As with all technical analysis tools, it is essential to use the Downside Tasuki Gap in conjunction with other indicators and analysis techniques to increase the reliability of trading signals and manage risks effectively.
By mastering the Downside Tasuki Gap pattern, traders can better navigate the complexities of financial markets and improve their chances of achieving consistent success.
EDUBRUG is a top educational institute known for offering the best stock market courses in India. Our goal is to make financial markets easy to understand and help people learn about trading. Eduburg has quickly become a popular choice for those who want to become successful traders and investors. Our experienced faculties, who are certified, provide practical training in stock trading, technical analysis, and financial planning. Eduburg is dedicated to providing high-quality education, ensuring that our students gain the skills and confidence needed to succeed in the stock market.