The Hammer Candlestick Pattern: A Comprehensive Guide
Introduction
The Hammer candlestick pattern is a vital tool in technical analysis, used by traders to identify potential reversals at the bottom of a downtrend. Its distinctive shape and implications for market sentiment make it a valuable indicator for anticipating bullish reversals. This article delves into the anatomy of the Hammer pattern, the psychology behind its formation, its significance in trading, and strategies for its effective use.
Anatomy of the Hammer Candlestick
The Hammer candlestick is characterized by:
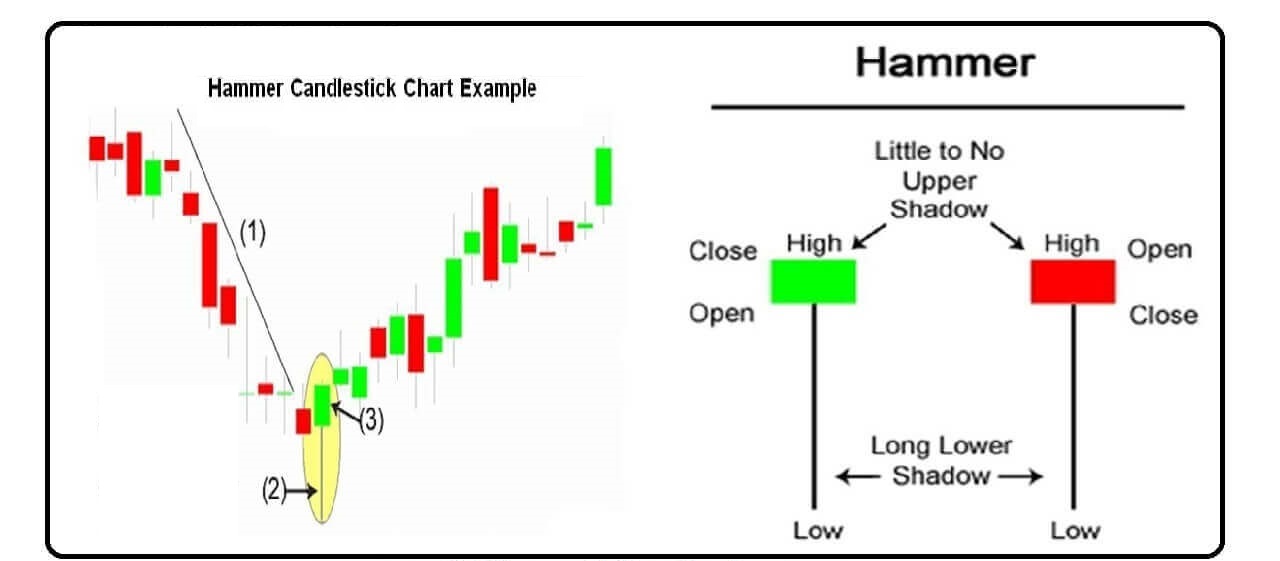
- Small Body: The body of the Hammer is small and positioned at the upper end of the trading range.
- Long Lower Shadow: The lower shadow is at least twice the length of the body, indicating that the market tested lower prices but rejected them.
- Little or No Upper Shadow: The absence or minimal presence of an upper shadow underscores the strength of the price rejection.
To qualify as a Hammer, the candlestick must form after a downtrend, indicating a potential reversal.
Types of Hammer Candlesticks
There are variations of the Hammer pattern, each providing different insights into market conditions:
- Standard Hammer:
- Description: Forms at the bottom of a downtrend with a small real body at the top of the range and a long lower shadow.
- Implication: Indicates a potential bullish reversal.
- Inverted Hammer:
- Description: Has a small body at the lower end of the trading range and a long upper shadow.
- Implication: Suggests a potential reversal, but requires confirmation from subsequent bullish price action.
Psychology Behind the Hammer Pattern
The Hammer pattern reflects a battle between buyers and sellers, where:
- Initial Selling Pressure: The market opens and moves significantly lower, continuing the downtrend.
- Strong Buying Interest: Buyers step in, pushing prices back up towards the opening level, reducing the day’s losses.
- Rejection of Lower Prices: The long lower shadow indicates that sellers tried to push prices down, but buyers ultimately prevailed, rejecting the lower prices.
This shift in momentum from sellers to buyers signals that the downtrend may be weakening, and a bullish reversal could be imminent.
Significance of the Hammer in Trading
The Hammer pattern is significant for several reasons:
- Reversal Indicator: It serves as a potential reversal signal at the bottom of a downtrend, alerting traders to a possible bullish turn.
- Market Sentiment Shift: It indicates a shift in sentiment from bearish to bullish, reflecting buyer strength.
- Enhanced by Volume: The reliability of the Hammer increases when accompanied by high trading volume, suggesting strong participation by buyers.
Trading Strategies Involving Hammer Patterns
To effectively trade using the Hammer pattern, consider the following strategies:
- Confirmation with Follow-Up Candles:
- Strategy: Wait for the next candle to confirm the reversal. A bullish candle following the Hammer strengthens the reversal signal.
- Example: After identifying a Hammer, observe the next trading day. If it closes higher, it confirms the bullish reversal, suggesting an entry point for a long position.
- Support Levels:
- Strategy: Identify Hammers forming near key support levels. This confluence increases the pattern’s reliability.
- Example: A Hammer forming at a historical support level provides a stronger reversal signal, suggesting a higher probability of a successful trade.
- Volume Analysis:
- Strategy: Confirm the Hammer with volume analysis. Higher volume on the Hammer day indicates strong buyer interest.
- Example: A Hammer accompanied by a spike in volume suggests significant buying pressure, reinforcing the reversal signal.
- Moving Averages:
- Strategy: Use moving averages to confirm the overall trend. A Hammer forming near a long-term moving average can indicate a potential reversal point.
- Example: A Hammer pattern appearing above the 200-day moving average provides a stronger buy signal, indicating a potential trend reversal.
Practical Example of the Hammer Pattern
Consider a stock in a downtrend, forming several consecutive bearish candles. On a particular day, the stock opens lower but closes near its opening price after significant buying pressure, forming a Hammer pattern. The next day, the stock opens higher and continues to rise, confirming the bullish reversal. Accompanied by high trading volume and forming near a support level, this Hammer pattern signals a strong buy opportunity.
Pros and Cons of the Hammer Candlestick Pattern
Pros
- Strong Reversal Signal:
- Pro: The Hammer pattern is a reliable indicator of a potential reversal from a downtrend to an uptrend. Its distinctive structure and implications for market sentiment provide traders with a clear signal of a possible bullish turn.
- Easy to Identify:
- Pro: The Hammer candlestick is visually distinctive and easy to spot on a chart, even for novice traders. Its small body and long lower shadow make it easily recognizable.
- Indicates Buyer Strength:
- Pro: The pattern indicates a significant rejection of lower prices and strong buying interest. This reflects a shift in market sentiment from bearish to bullish, which can be a precursor to a price increase.
- Enhanced Reliability with Volume:
- Pro: When the Hammer pattern is accompanied by high trading volume, its reliability as a reversal signal increases. High volume suggests strong participation by buyers, reinforcing the pattern’s significance.
- Versatility Across Markets:
- Pro: The Hammer pattern can be applied across various financial markets, including stocks, forex, commodities, and cryptocurrencies. This makes it a versatile tool for traders in different markets.
Cons
- Requires Confirmation:
- Con: A single Hammer pattern does not guarantee a trend reversal. Traders need to wait for confirmation from subsequent price action or additional technical indicators to validate the signal and avoid false positives.
- Potential for False Signals:
- Con: The Hammer pattern can sometimes produce false signals, especially in volatile or choppy markets. This can lead to premature entries into trades that may not result in the expected reversal.
- Context Dependence:
- Con: The effectiveness of the Hammer pattern depends on its context within the broader market trend and conditions. Without considering the overall trend and other technical factors, traders might misinterpret the pattern.
- Limited Predictive Power in Isolation:
- Con: While the Hammer pattern indicates a potential reversal, it does not provide information about the extent or duration of the new trend. It should be used as part of a broader analysis rather than in isolation.
- Requires Additional Analysis:
- Con: To increase the reliability of the Hammer pattern, traders often need to combine it with other technical analysis tools and indicators. This additional analysis can complicate the trading strategy, especially for beginners.
The Hammer candlestick pattern is a valuable tool in technical analysis, offering clear signals of potential trend reversals from downtrends to uptrends. Its ease of identification and implications for market sentiment make it a popular choice among traders. However, like any trading tool, it has its limitations. The pattern requires confirmation from additional indicators and analysis to mitigate the risk of false signals and ensure more accurate trading decisions. By understanding the pros and cons of the Hammer pattern, traders can effectively incorporate it into their trading strategies for better outcomes.
Conclusion
The Hammer candlestick pattern is a powerful indicator of potential trend reversals, offering traders insights into market sentiment and the potential for bullish reversals. By understanding its formation, psychology, and significance, and by combining it with other technical indicators and strategies, traders can enhance their ability to identify profitable trading opportunities. However, it is essential to confirm the pattern with additional analysis to mitigate the risk of false signals and ensure successful trading outcomes.
EDUBRUG is a top educational institute known for offering the best stock market courses in India. Our goal is to make financial markets easy to understand and help people learn about trading. Eduburg has quickly become a popular choice for those who want to become successful traders and investors. Our experienced faculties, who are certified, provide practical training in stock trading, technical analysis, and financial planning. Eduburg is dedicated to providing high-quality education, ensuring that our students gain the skills and confidence needed to succeed in the stock market.