Head and Shoulders Pattern in Technical Analysis
The Head and Shoulders pattern is one of the most widely recognized and reliable chart patterns in technical analysis. It is used by traders and analysts to predict a reversal in the trend of a financial instrument. This pattern typically signals a bearish reversal, indicating that an upward trend is coming to an end and a downward trend is likely to begin. The Head and Shoulders pattern consists of three peaks: a higher middle peak (the head) flanked by two lower peaks (the shoulders). The formation of this pattern and its implications are discussed in detail below.
Structure of the Head and Shoulders Pattern
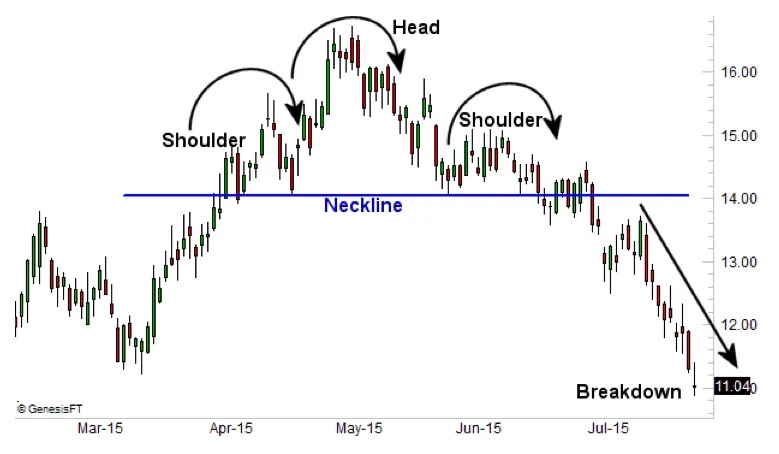
- Left Shoulder: The pattern begins with the formation of the left shoulder, which is characterized by a peak that marks the end of a substantial uptrend. After reaching this peak, the price experiences a decline, typically on lower volume, forming the left shoulder.
- Head: Following the formation of the left shoulder, the price rallies again to form a higher peak, known as the head. This peak surpasses the height of the left shoulder. After reaching the highest point (the head), the price declines once more, often on higher volume compared to the decline after the left shoulder.
- Right Shoulder: The right shoulder forms after the price decline from the head. This peak is lower than the head but generally around the same height as the left shoulder. The decline from the right shoulder completes the pattern.
- Neckline: The neckline is a crucial component of the Head and Shoulders pattern. It is formed by drawing a line connecting the lows of the two troughs (the low points between the shoulders and the head). This line can be horizontal or sloped, depending on the specific price action. The neckline serves as a critical support level.
Confirmation of the Pattern
The Head and Shoulders pattern is not considered complete until the price breaks below the neckline. This breakout is the signal that confirms the pattern and suggests that a bearish trend reversal is likely to occur. Volume is an important factor in confirming the breakout. Ideally, the decline below the neckline should occur on higher volume, indicating stronger selling pressure.
Measuring the Price Target
Traders often use the Head and Shoulders pattern to estimate the potential price target of the resulting downtrend. The price target is calculated by measuring the vertical distance from the highest point of the head to the neckline. This distance is then subtracted from the breakout point (where the price breaks the neckline) to project the potential downside target.
Price Target=Neckline Breakout Point−(Head Height−Neckline)\text{Price Target} = \text{Neckline Breakout Point} – (\text{Head Height} – \text{Neckline})
Variations of the Head and Shoulders Pattern
- Complex Head and Shoulders: Sometimes, the Head and Shoulders pattern can have more than three peaks. These variations are known as complex Head and Shoulders patterns and may include additional shoulders or heads. The underlying principle remains the same, but these patterns can be more challenging to identify and interpret.
- Inverse Head and Shoulders: The Inverse Head and Shoulders pattern is a bullish reversal pattern that mirrors the traditional Head and Shoulders pattern. It forms after a downtrend and consists of three troughs: a lower middle trough (the head) flanked by two higher troughs (the shoulders). The breakout above the neckline confirms the pattern and signals a potential upward trend.
Significance of Volume
Volume plays a crucial role in validating the Head and Shoulders pattern. Typically, volume should decrease during the formation of the left shoulder and head, and then increase during the formation of the right shoulder and the subsequent decline below the neckline. Higher volume on the breakout below the neckline is considered a stronger confirmation of the pattern and the ensuing downtrend.
Practical Considerations
- Context of the Trend: The Head and Shoulders pattern is most effective when it forms after a sustained uptrend. It indicates that the buying momentum is waning and the market is likely to reverse direction.
- Time Frame: The pattern can appear on various time frames, from intraday charts to long-term charts. However, patterns on longer time frames (daily, weekly) tend to have greater significance and reliability.
- Stop-Loss Placement: Traders often place stop-loss orders above the right shoulder or the head to manage risk in case the pattern fails and the price reverses back upwards.
- Confirmation: Relying solely on the pattern without waiting for a breakout confirmation can be risky. It’s crucial to wait for the price to break below the neckline on higher volume to confirm the pattern.
Example of Head and Shoulders Pattern
Let’s consider a hypothetical example to illustrate the Head and Shoulders pattern. Suppose the stock price of XYZ Corporation has been in an uptrend, reaching a peak of $100 (left shoulder). After a decline to $90, the price rallies again to $110 (head) before falling back to $90. Finally, the price rises to $95 (right shoulder) and then declines once more. The neckline, connecting the two troughs at $90, serves as a support level. When the price breaks below $90 on increased volume, it confirms the Head and Shoulders pattern, suggesting a potential decline to $80 (calculated by subtracting the height of the head from the neckline).
Conclusion
The Head and Shoulders pattern is a powerful tool in technical analysis that helps traders and analysts identify potential trend reversals from bullish to bearish. Its distinctive formation and reliance on volume for confirmation make it a reliable indicator of market sentiment. By understanding the structure, variations, and practical considerations associated with this pattern, traders can make informed decisions and manage risk effectively in their trading strategies.
EDUBRUG is a top educational institute known for offering the best stock market courses in India. Our goal is to make financial markets easy to understand and help people learn about trading. Eduburg has quickly become a popular choice for those who want to become successful traders and investors. Our experienced faculties, who are certified, provide practical training in stock trading, technical analysis, and financial planning. Eduburg is dedicated to providing high-quality education, ensuring that our students gain the skills and confidence needed to succeed in the stock market.