High Wave Candlestick Pattern: A Comprehensive Guide
Introduction
The High Wave candlestick pattern is a unique and insightful pattern used in technical analysis to understand market sentiment and potential future price movements. This pattern indicates indecision in the market and can signal potential reversals or continuations, depending on the context in which it appears. Understanding and identifying the High Wave pattern can help traders make more informed decisions. This article will explore the formation, characteristics, interpretation, and practical trading strategies associated with the High Wave candlestick pattern.
Understanding the High Wave Pattern
The High Wave pattern consists of a single candlestick characterized by a very small real body and extremely long upper and lower shadows. This pattern indicates significant volatility and indecision among traders, as the price fluctuates widely within the trading session but closes near its opening price.
Formation and Characteristics
The High Wave pattern is easy to identify due to its distinct features:
- Small Real Body: The candlestick has a very small real body, meaning the opening and closing prices are very close to each other.
- Long Upper Shadow: The upper shadow (wick) is long, indicating that the price reached much higher levels during the trading session but did not maintain those levels.
- Long Lower Shadow: The lower shadow (tail) is also long, showing that the price dropped significantly during the session but did not stay at those lower levels.
Interpreting the High Wave Pattern
The High Wave pattern provides valuable insights into market psychology and potential future price movements:
- Indecision: The pattern indicates indecision among traders. Neither buyers nor sellers can maintain control, leading to significant price swings but little change from the opening to the closing price.
- Volatility: The long shadows suggest high volatility within the trading session. Prices moved dramatically up and down but ended up close to where they started.
- Potential Reversal or Continuation: The context in which the High Wave pattern appears determines its interpretation. In an uptrend, it may signal a potential reversal to the downside. In a downtrend, it could indicate a potential reversal to the upside. In a sideways market, it may suggest continued indecision and a possible continuation of the range-bound behavior.
Practical Trading Strategies
Traders can use the High Wave pattern to develop effective trading strategies. Here are some practical approaches:
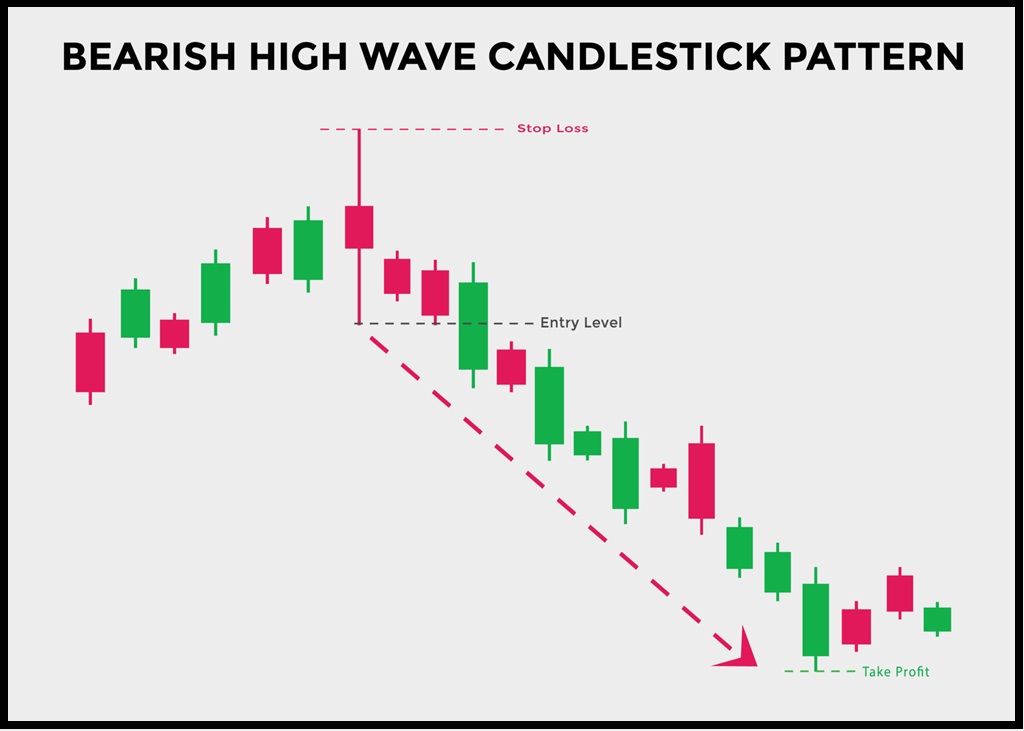
- Confirming Reversals: Look for the High Wave pattern at key support or resistance levels. If it appears after a prolonged uptrend at a resistance level, it may signal a bearish reversal. Conversely, if it appears after a downtrend at a support level, it could indicate a bullish reversal.
- Example: If a stock has been rising steadily and forms a High Wave pattern near a known resistance level, a trader might prepare for a potential reversal and consider shorting the stock if other indicators confirm the signal.
- Using Additional Indicators: To confirm the signal provided by the High Wave pattern, use other technical indicators such as moving averages, relative strength index (RSI), or volume analysis.
- Example: Before acting on a High Wave pattern, a trader might check if the RSI is overbought (above 70) or oversold (below 30) to confirm a potential reversal.
- Stop-Loss Placement: To manage risk, traders can place stop-loss orders above the high of the High Wave candlestick in a potential bearish reversal or below the low in a potential bullish reversal.
- Example: If trading a potential bearish reversal signaled by a High Wave pattern, place a stop-loss order slightly above the upper shadow to limit losses if the price continues to rise.
Example of High Wave Pattern in Action
Consider a stock that has been in an uptrend. On a particular trading day, the stock opens at $50, rises to $55, drops to $45, and then closes at $51. This results in a candlestick with a very small real body ($50-$51) and long upper ($55) and lower ($45) shadows. This High Wave pattern indicates significant indecision and potential for a reversal, especially if it appears near a key resistance level.
Limitations and Considerations
While the High Wave pattern is useful, it’s important to consider its limitations:
- Context Matters: The pattern’s interpretation heavily depends on the context of the prevailing trend. Always consider the overall trend and market conditions.
- Need for Confirmation: Relying solely on the High Wave pattern without additional confirmation from other indicators can lead to false signals.
- Market Conditions: The pattern is most effective in trending markets. In sideways or choppy markets, its predictive power may be reduced.
Conclusion
The High Wave candlestick pattern is a valuable tool for traders looking to understand market sentiment and potential future price movements. By recognizing the pattern’s formation, interpreting its signals, and using it in conjunction with other technical analysis tools, traders can make more informed trading decisions.
By mastering the High Wave pattern, traders can better navigate the complexities of financial markets and improve their chances of achieving consistent success. As with all technical analysis tools, it is essential to use the High Wave pattern as part of a comprehensive trading strategy to manage risks effectively and maximize potential rewards.
EDUBRUG is a top educational institute known for offering the best stock market courses in India. Our goal is to make financial markets easy to understand and help people learn about trading. Eduburg has quickly become a popular choice for those who want to become successful traders and investors. Our experienced faculties, who are certified, provide practical training in stock trading, technical analysis, and financial planning. Eduburg is dedicated to providing high-quality education, ensuring that our students gain the skills and confidence needed to succeed in the stock market.