Understanding the On-Neck Pattern: A Simple Guide
Introduction
In the world of trading, understanding candlestick patterns can help traders predict potential market movements. One such pattern is the On-Neck pattern. This pattern is not as commonly discussed as others but is important for traders to know, especially when it comes to recognizing the continuation of a bearish trend. In this guide, we’ll explain what the On-Neck pattern is, how it forms, what it signifies, and how you can use it in your trading strategy.

What is the On-Neck Pattern?
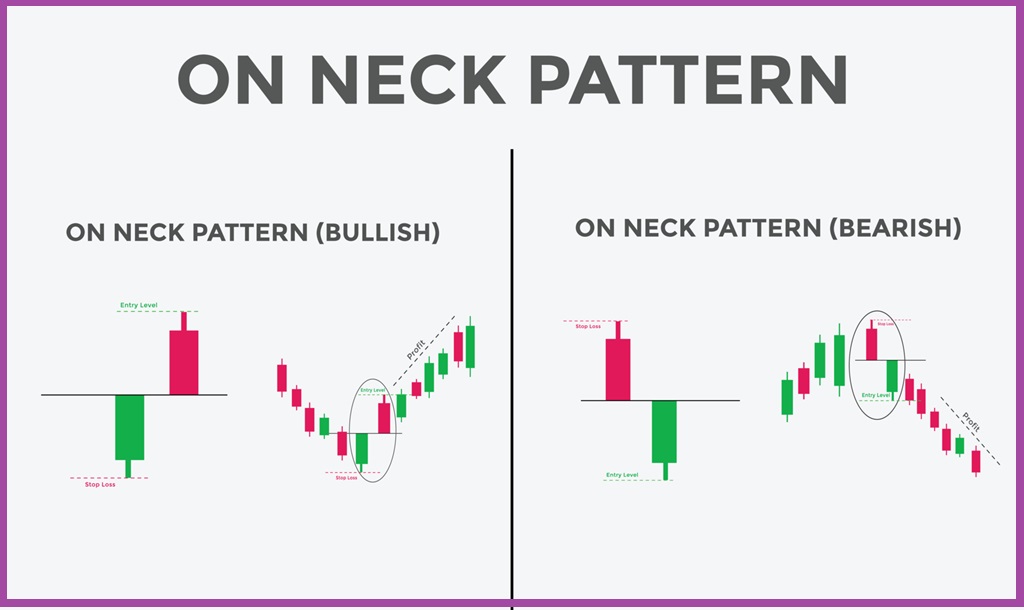
The On-Neck pattern is a two-candlestick pattern that appears during a downtrend. It suggests that the bearish trend will likely continue. The pattern consists of:
- First Candlestick (Bearish):
- This is a long, bearish (red or black) candlestick showing strong selling pressure.
- Second Candlestick (Bullish):
- This is a smaller, bullish (green or white) candlestick that opens below the closing price of the first candlestick and closes near or slightly above the first candlestick’s close.
How the On-Neck Pattern Forms
For an On-Neck pattern to be valid, it must meet these conditions:
- The market must be in a downtrend.
- The first candlestick should be long and bearish.
- The second candlestick should be small and bullish, opening below the first candlestick’s close and closing near or slightly above the first candlestick’s close without forming a gap.
What the On-Neck Pattern Tells Us
The On-Neck pattern provides insights into market sentiment:
- Initial Bearish Sentiment:
- The first long bearish candlestick shows that sellers are in control, continuing the downtrend.
- Weak Bullish Response:
- The second small bullish candlestick indicates that buyers tried to push the price up but didn’t succeed significantly. This shows that the buying pressure is weak.
- Continuation of the Downtrend:
- The fact that the second candlestick closes near the first one’s close, without forming a gap, suggests that the bearish trend is likely to continue.
Significance of the On-Neck Pattern
The On-Neck pattern is significant for traders because:
- Continuation Signal:
- It signals that the current downtrend is likely to continue, so traders might decide to hold onto their short positions or enter new ones.
- Confirmation of Market Sentiment:
- It confirms that sellers are still in control and buyers’ attempts to reverse the trend are weak.
- Applicable to Different Timeframes:
- You can spot the On-Neck pattern on different timeframes, from daily to weekly charts, making it versatile for various trading strategies.
How to Trade Using the On-Neck Pattern
Here are some strategies for trading with the On-Neck pattern:
- Confirm with Volume:
- Look for an increase in trading volume during the formation of the bearish candlestick. This supports the continuation of the downtrend.
- Support and Resistance Levels:
- Identify the On-Neck pattern near key resistance levels to increase its reliability. This means the price might have a harder time breaking above these levels, reinforcing the bearish signal.
- Use Moving Averages:
- Confirm the pattern with moving averages. If the On-Neck pattern forms near a long-term moving average, it strengthens the signal of a continued downtrend, especially if moving averages cross in a bearish direction.
- Entry and Exit Points:
- Enter a short position at the close of the second candlestick. Place a stop-loss order above the high of the second candlestick to manage risk. Set take-profit levels based on nearby support levels or use a trailing stop to capture more profits as the trend continues.
Example of the On-Neck Pattern
Imagine a stock that has been falling for several days. Then, a long bearish candlestick forms, followed by a smaller bullish candlestick that closes near the previous candlestick’s close. This pattern suggests the downtrend will continue. Traders might use this signal to enter short positions, expecting the price to keep dropping.
Pros and Cons of the On-Neck Pattern
Pros
- Clear Signal:
- Provides a clear indication that the downtrend is likely to continue.
- Market Sentiment Confirmation:
- Confirms that the sellers remain in control.
- Versatility:
- Can be used on different timeframes, making it suitable for various trading strategies.
Cons
- False Signals:
- Can sometimes give false signals, especially in volatile or choppy markets.
- Context Dependency:
- Effectiveness depends on the broader market context. It’s essential to use other indicators and market factors to validate the pattern.
- Risk Management Needed:
- Proper risk management strategies are crucial. This includes setting stop-loss orders and managing position sizes to avoid significant losses.
Conclusion
The On-Neck pattern is a valuable tool for traders who need to identify and confirm bearish continuation signals. By understanding its formation and implications, traders can make more informed decisions about maintaining or entering short positions. However, like all technical patterns, it should not be used in isolation. Combining it with other technical indicators, market analysis, and solid risk management practices will enhance its effectiveness and help traders navigate the financial markets more successfully.
By practicing and observing the On-Neck pattern in real-market scenarios, traders can refine their skills and develop a more profound understanding of market dynamics. This knowledge will help them better anticipate potential trend continuations and position themselves advantageously in their trading endeavors.

EDUBRUG is a top educational institute known for offering the best stock market courses in India. Our goal is to make financial markets easy to understand and help people learn about trading. Eduburg has quickly become a popular choice for those who want to become successful traders and investors. Our experienced faculties, who are certified, provide practical training in stock trading, technical analysis, and financial planning. Eduburg is dedicated to providing high-quality education, ensuring that our students gain the skills and confidence needed to succeed in the stock market.