Support and Resistance: A Comprehensive Guide to Technical Analysis in the Stock Market
In the intricate world of financial markets, where prices fluctuate rapidly and trends emerge and fade, understanding the concept of support and resistance is paramount for investors and traders alike. Support and resistance analysis forms the backbone of technical analysis, providing valuable insights into market dynamics, price movements, and potential trading opportunities. In this extensive article, we embark on a journey into the realm of support and resistance analysis in the stock market, exploring its fundamental principles, key methodologies, advanced techniques, practical applications, and case studies, drawing insights from seasoned traders, technical analysts, and reputable sources in the field.
Part 1: Understanding Support and Resistance Analysis
Support and resistance analysis is a key component of technical analysis, which focuses on analyzing historical price data, chart patterns, and market trends to forecast future price movements and identify potential entry and exit points for trades. At its core, support and resistance analysis seeks to identify levels at which buying and selling pressures converge, leading to significant price reactions and trend reversals.
1.1 Definition and Objectives
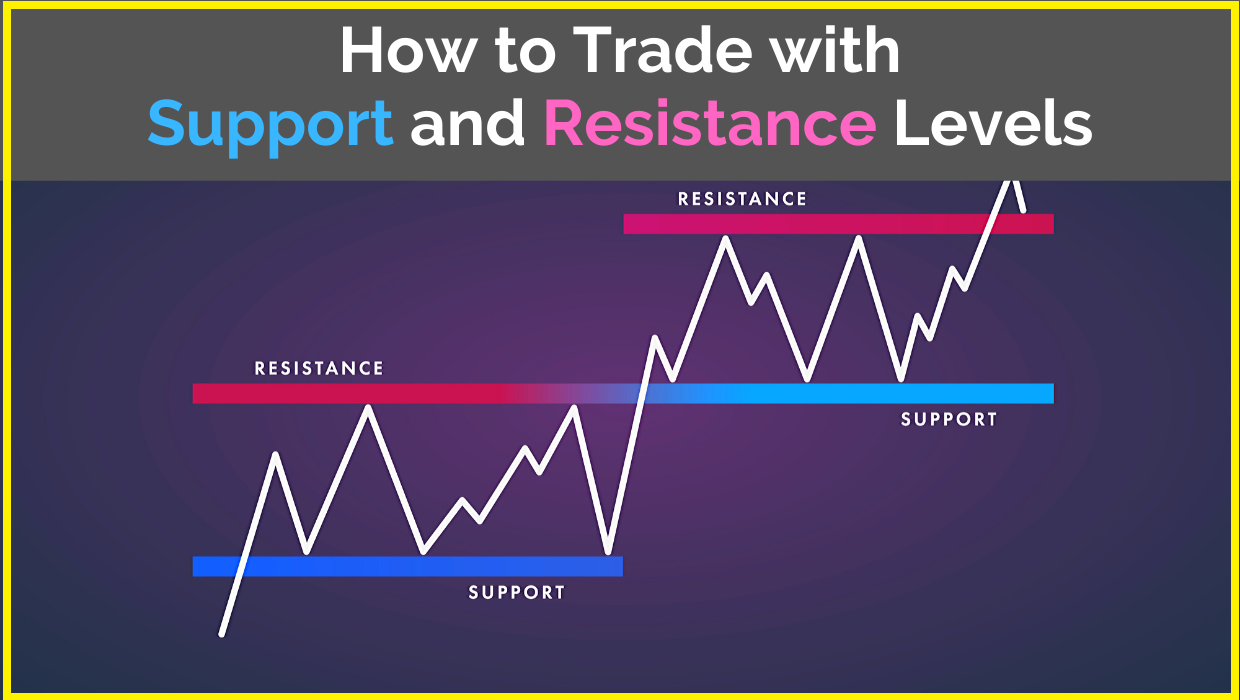
Support and resistance levels are psychological barriers that represent areas where the supply and demand for a stock are expected to converge, leading to either a price floor (support) or a price ceiling (resistance). The primary objectives of support and resistance analysis include:
- Identifying Price Levels: Identifying key support and resistance levels based on historical price data, chart patterns, and market structure.
- Confirming Trends: Confirming the direction of prevailing trends and assessing the strength of bullish or bearish momentum in the market.
- Timing Trades: Timing entry and exit points for trades based on support and resistance levels to maximize profits and minimize losses.
1.2 Fundamental Principles
Support and resistance analysis is guided by several fundamental principles, including:
- Price Memory: The concept of price memory suggests that past price levels often influence future price behavior, as investors and traders remember previous price levels and react accordingly.
- Supply and Demand Dynamics: Support and resistance levels are determined by the interplay between supply (selling pressure) and demand (buying pressure) in the market, with support representing demand zones and resistance representing supply zones.
- Role Reversal: Once a support level is breached, it tends to act as resistance, and vice versa, as traders reassess their positions and sentiment shifts in the market.
Part 2: Key Methodologies of Support and Resistance Analysis
Support and resistance analysis employs various methodologies and tools to identify, validate, and utilize support and resistance levels effectively. Some of the key methodologies include:
2.1 Price Action Analysis
Price action analysis involves analyzing the raw price movement of a stock, without the use of indicators or oscillators, to identify key support and resistance levels and detect potential trading opportunities. Key components of price action analysis include:
- Swing Highs and Lows: Identifying swing highs (peaks) and swing lows (troughs) in the price chart to determine potential support and resistance levels.
- Trendlines: Drawing trendlines connecting successive swing highs or lows to identify trend directions and potential areas of support or resistance.
- Chart Patterns: Recognizing chart patterns, such as double tops, double bottoms, head and shoulders, and triangles, which often indicate areas of support and resistance.
2.2 Moving Averages Analysis
Moving averages analysis involves using moving averages, such as simple moving averages (SMA) or exponential moving averages (EMA), to identify trends, support, and resistance levels in the price chart. Key components of moving averages analysis include:
- SMA and EMA: Plotting moving averages of different time periods (e.g., 50-day SMA, 200-day SMA) on the price chart to identify trend directions and potential areas of support or resistance.
- Moving Average Crossovers: Analyzing the crossover of short-term and long-term moving averages to identify potential trend reversals or confirmation signals.
- Moving Average Envelopes: Using moving average envelopes, which consist of upper and lower bands around a moving average, to identify potential overbought or oversold conditions and support and resistance levels.
2.3 Fibonacci Retracement Analysis
Fibonacci retracement analysis involves using Fibonacci ratios, such as 23.6%, 38.2%, 50%, 61.8%, and 100%, to identify potential support and resistance levels in the price chart. Key components of Fibonacci retracement analysis include:
- Swing High and Low: Identifying the most recent significant swing high and swing low in the price chart to establish the reference points for Fibonacci retracement levels.
- Applying Fibonacci Retracements: Drawing Fibonacci retracement levels from the swing high to the swing low (or vice versa) to identify potential support and resistance levels where price retracements are likely to occur.
- Confirmation Signals: Looking for confirmation signals, such as price consolidation, candlestick patterns, or trendline confluence, to validate Fibonacci retracement levels as potential areas of support or resistance.
Part 3: Advanced Techniques in Support and Resistance Analysis
In addition to traditional methodologies, advanced techniques and tools are employed in support and resistance analysis to gain deeper insights into market dynamics and price behavior. Some of these techniques include:
3.1 Volume Analysis
Volume analysis involves analyzing trading volume, which represents the number of shares traded during a given period, to validate support and resistance levels and assess the strength of price movements. Key components of volume analysis include:
- Volume Profile: Plotting volume profiles or histograms on the price chart to visualize the distribution of trading volume at different price levels and identify areas of high volume (support or resistance).
- Volume Confirmation: Looking for volume confirmation signals, such as increasing volume during a breakout or decreasing volume during a pullback, to validate the significance of support and resistance levels.
- Volume Oscillators: Using volume-based oscillators, such as the On-Balance Volume (OBV) indicator or the Volume-Weighted Average Price (VWAP), to analyze the relationship between price and volume and identify potential reversal or continuation patterns.
3.2 Market Internals Analysis
Market internals analysis involves analyzing internal market indicators, such as market breadth, market depth, and advance-decline lines, to assess the overall health and strength of the market and validate support and resistance levels. Key components of market internals analysis include:
- Advance-Decline Line: Plotting the advance-decline line, which measures the number of advancing stocks versus declining stocks in the market, to assess the breadth of market participation and confirm support and resistance levels.
- New Highs and Lows: Monitoring the number of new highs and new lows in the market to gauge market sentiment and identify potential areas of support or resistance.
- Market Breadth Indicators: Using market breadth indicators, such as the McClellan Oscillator or the Arms Index (TRIN), to measure the ratio of advancing volume to declining volume and assess the strength of market trends.
3.3 Machine Learning
Techniques Machine learning techniques are increasingly being applied to support and resistance analysis to enhance predictive capabilities and automate the identification of key levels. Key components of machine learning techniques include:
- Pattern Recognition: Using machine learning algorithms, such as support vector machines (SVM), random forests, or neural networks, to recognize patterns and trends in historical price data and identify potential support and resistance levels.
- Feature Engineering: Extracting relevant features, such as price volatility, trading volume, or price action patterns, from historical data to train machine learning models and improve the accuracy of support and resistance level predictions.
- Algorithmic Trading: Incorporating machine learning models into algorithmic trading strategies to automatically identify support and resistance levels, generate trading signals, and execute trades based on predefined rules and criteria.
Part 4: Practical Applications and Case Studies
Support and resistance analysis has a wide range of practical applications in the stock market, including trend identification, trade entry and exit points, risk management, and strategy development. Let’s explore some practical applications of support and resistance analysis and review case studies that demonstrate its effectiveness:
4.1 Practical Applications
- Trend Identification: Support and resistance analysis helps traders identify the direction of prevailing trends and assess the strength of bullish or bearish momentum in the market.
- Trade Entry and Exit Points: Support and resistance levels serve as key decision points for traders to enter or exit trades, set stop-loss orders, or take profit targets.
- Risk Management: Support and resistance analysis enables traders to manage risk effectively by placing stop-loss orders below support levels (for long positions) or above resistance levels (for short positions) to limit potential losses.
- Strategy Development: Support and resistance analysis forms the basis of many trading strategies, such as trend-following strategies, breakout strategies, and range-bound strategies, which rely on identifying and exploiting key support and resistance levels.
4.2 Case Studies
Let’s review two case studies that highlight the practical applications of support and resistance analysis in the stock market:
- Case Study 1: Breakout Trading Strategy
- Background: A trader identifies a potential breakout opportunity in a stock that has been trading within a tight range for an extended period.
- Support and Resistance Analysis: The trader uses support and resistance analysis to identify key levels where buying and selling pressures converge, including the upper and lower boundaries of the trading range.
- Breakout Confirmation: Once the stock price breaks above the upper boundary of the trading range (resistance level), the trader initiates a long position, expecting further upside momentum.
- Risk Management: The trader sets a stop-loss order below the breakout level (previous resistance-turned-support) to limit potential losses in case the breakout fails.
- Outcome: The stock price continues to rally after the breakout, generating profits for the trader who successfully identified and capitalized on the breakout opportunity.
- Case Study 2: Trend Reversal Signal
- Background: A technical analyst identifies a potential trend reversal signal in a stock that has been in a downtrend for an extended period.
- Support and Resistance Analysis: The technical analyst uses support and resistance analysis to identify key levels where selling pressure may wane and buying interest may emerge, including previous swing lows (potential support levels).
- Reversal Confirmation: Once the stock price forms a bullish reversal pattern, such as a double bottom or a bullish engulfing candlestick pattern, near a support level, the analyst interprets it as a potential signal of trend reversal.
- Risk Management: The analyst sets a stop-loss order below the recent swing low or support level to limit potential losses if the reversal signal proves to be false.
- Outcome: The stock price reverses direction after the bullish reversal pattern, confirming the trend reversal signal and generating profits for the analyst who correctly identified the potential reversal opportunity.
Part 5: Conclusion
In conclusion, support and resistance analysis is a foundational concept in technical analysis that provides valuable insights into market dynamics, price movements, and potential trading opportunities in the stock market. By understanding the fundamental principles, key methodologies, advanced techniques, and practical applications of support and resistance analysis, traders and investors can enhance their decision-making process, improve their trading strategies, and navigate the complexities of the market with confidence and precision.
EDUBRUG is a top educational institute known for offering the best stock market courses in India. Our goal is to make financial markets easy to understand and help people learn about trading. Eduburg has quickly become a popular choice for those who want to become successful traders and investors. Our experienced faculties, who are certified, provide practical training in stock trading, technical analysis, and financial planning. Eduburg is dedicated to providing high-quality education, ensuring that our students gain the skills and confidence needed to succeed in the stock market.