The Falling Window Candlestick Pattern: A Simple Guide
Introduction
The Falling Window candlestick pattern is an important tool in technical analysis used to predict future price movements in the stock market. This pattern signals that a downward trend, or bearish trend, is likely to continue. Understanding the Falling Window pattern can help traders make better decisions about buying or selling stocks. This guide will explain what the Falling Window pattern is, how to identify it, and how to use it in trading.
What is the Falling Window Pattern?
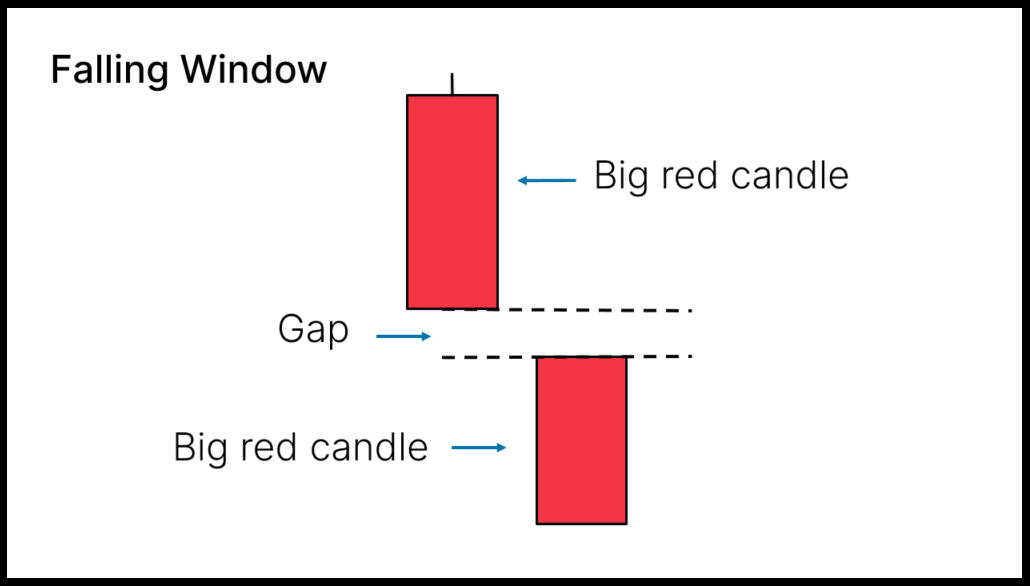
The Falling Window pattern appears when there is a noticeable gap between two candlesticks on a price chart. This gap indicates strong selling pressure and suggests that prices will likely continue to fall. The pattern consists of two candlesticks:
- First Candlestick: This is a bearish candlestick, meaning the closing price is lower than the opening price. It indicates that sellers are in control.
- Second Candlestick: This candlestick opens below the low point of the first candlestick, creating a gap, and it also closes lower, reinforcing the downward movement.
How to Identify the Falling Window Pattern
To spot a Falling Window pattern on a chart, look for these key elements:
- Bearish Candlestick: The first candlestick should clearly show a decline, with the closing price lower than the opening price.
- Gap Down: The second candlestick opens significantly lower than the first candlestick’s low point, creating a visible gap on the chart.
- Continuation: The second candlestick also closes lower, maintaining the gap and indicating continued selling pressure.
Why the Falling Window Pattern Matters
The Falling Window pattern is valuable for several reasons:
- Continuation Signal: It shows that the current downtrend is likely to continue, helping traders align their strategies with the prevailing market direction.
- Market Sentiment: The gap down indicates strong selling interest and weak buying pressure, reinforcing the bearish sentiment.
- Trend Strength: The size of the gap and the second candlestick’s performance suggest the strength of the downtrend. A larger gap often indicates stronger bearish momentum.
How to Use the Falling Window Pattern in Trading
Traders can use the Falling Window pattern to make informed trading decisions. Here are some practical strategies:
- Entering Short Positions: Traders can enter short positions (betting that the price will go down) after the formation of the second candlestick, expecting the downtrend to continue.
- Example: If a stock shows a Falling Window pattern, a trader might sell the stock or enter a short position on the day following the formation of the second candlestick, anticipating further price declines.
- Setting Stop-Loss Orders: To manage risk, traders can place stop-loss orders above the gap. This protects against potential reversals.
- Example: For a Falling Window pattern, the stop-loss order can be placed above the high of the first candlestick. If the price moves above this level, the trader’s position will be closed to limit losses.
- Using Other Indicators: To confirm the signal from the Falling Window pattern, traders often use other technical indicators like moving averages, the relative strength index (RSI), or volume analysis.
- Example: Before entering a short position based on the Falling Window pattern, a trader might check if the RSI is below 50, indicating bearish momentum, or if the trading volume during the formation of the pattern is higher than average, confirming strong selling pressure.
Example of the Falling Window Pattern in Action
Consider a stock that has been declining steadily. On Day 1, the stock forms a bearish candlestick, closing lower than it opened. On Day 2, the stock opens significantly lower than the previous day’s low, creating a gap, and closes even lower. This sequence forms a Falling Window pattern, suggesting the downtrend will continue.
Limitations and Considerations
While the Falling Window pattern is useful, it’s important to be aware of its limitations:
- Market Conditions: The pattern works best in trending markets. In sideways or choppy markets, it might not be as reliable.
- Gap Size: Larger gaps generally indicate stronger bearish momentum, while smaller gaps might not be as significant.
- Need for Confirmation: Using the Falling Window pattern alone can lead to false signals. It’s best to confirm with other indicators or patterns.
- Time Frame: The pattern’s effectiveness can vary across different time frames. Always consider the overall trend and the specific time frame you are trading in.
Conclusion
The Falling Window candlestick pattern is a powerful tool for traders looking to identify and capitalize on continued bearish momentum in the market. By understanding how to spot this pattern and interpret its signals, traders can make more informed decisions and manage their trades more effectively. Like all technical analysis tools, the Falling Window pattern should be used in conjunction with other indicators and analysis techniques to increase the reliability of trading signals and manage risks properly.
By mastering the Falling Window pattern, traders can enhance their ability to navigate the financial markets and improve their chances of achieving consistent success.
EDUBRUG is a top educational institute known for offering the best stock market courses in India. Our goal is to make financial markets easy to understand and help people learn about trading. Eduburg has quickly become a popular choice for those who want to become successful traders and investors. Our experienced faculties, who are certified, provide practical training in stock trading, technical analysis, and financial planning. Eduburg is dedicated to providing high-quality education, ensuring that our students gain the skills and confidence needed to succeed in the stock market.